Interim Report Q1/2018. Mikko Forsell, CFO 3 May 2018
|
|
|
- Colin Thompson
- 5 years ago
- Views:
Transcription

1 Interim Report Q1/2018 Mikko Forsell, CFO 3 May 2018
2 Q1 result still heavily burdened by the Rauma poultry unit ramp-up costs Highlights Lowlights Poultry delivery capability clearly improved in Finland From Farm to Fork strategy with a strong focus on improving cost efficiency and productivity advanced Agreement to establish a joint venture in China signed Meat market continued to grow, particularly in Finland Rauma poultry unit ramp-up - Result still burdened by the challenges, although improved vs. previous quarter - Measures taken to secure the customer supplies caused additional costs - Performance not yet on an acceptable level Rakvere strike caused lost sales and extra costs INTERIM REPORT Q1/2018 2
3 HKScan Group Q1/2018 EUR million Q1/2018 Q1/ Net Sales 411,0 420, ,1 EBIT -18,6-6,8-40,3 - % of net sales -4,5 % -1,6 % -2,2 % Profit/loss before taxes -21,2-8,2-49,2 - % of net sales -5,1 % -2,0 % -2,7 % Profit/loss for the period -17,1-7,0-42,4 Comparable EBIT -18,4-6,8-17,6 - % of net sales -4,5 % -1,6 % -1,0 % Comparable profit/loss before taxes -20,9-8,2-26,5 - % of net sales -5,1 % -2,0 % -1,5 % EPS,EUR -0,32-0,14-0,84 Return on capital employed (ROCE) before taxes, % -7,8 % 1,8 % -6,3 % Comparable ROCE before taxes, % -4,2 % 2,2 % -2,4 % Net gearing, % 95,1 % 46,5 % 59,3 % Personnel INTERIM REPORT Q1/2018 3
4 HKScan Group - Net sales and profitability decreased Rauma poultry unit ramp-up challenges postponed the poultry product sales and campaigns in Finland Net sales decreased in Sweden due to currency impact Seasonality, increased production costs, material losses and lost sales due to the Rauma burdened Group s EBIT Rauma EBIT impact per quarter: Q2/17: -1 meur, Q3/17: -6 meur, Q4/17: -18 meur, Q1/18: -10 meur INTERIM REPORT Q1/2018 4

5 Sweden Net sales increased in local currency, EBIT affected by temporary increase in operational costs Total product sales increased slightly in local currency Growth driven by improved demand and increased market share particularly in processed categories EBIT decreased due to temporarily higher operational costs, mainly driven by increased electricity costs INTERIM REPORT Q1/2018 5

6 Finland - Net sales and EBIT impacted by the ramp-up of Rauma poultry unit Rauma ramp-up challenges postponed poultry sales The overall product sales in retail developed positively, particularly in the meals category The general market growth in all categories sped up towards the end of the quarter Rauma EBIT impact per quarter: Q2/17: -1 meur, Q3/17: -6 meur, Q4/17: -18 meur, Q1/18: -10 meur INTERIM REPORT Q1/2018 6

7 Denmark Net sales stable, EBIT improved Net sales boosted by the positive development of export sales Branded sales in retail were kept under pressure by a fierce price competition Improvement due to the continuing improvement of operational efficiency INTERIM REPORT Q1/2018 7

8 Baltics Temporary increase in costs due to strike Slaughterhouse strike activities at the Rakvere unit lowered the volumes temporarily Good growth in domestic retail sales continued and the share of novelties increased Strike activities temporarily lowered productivity and increased costs The change in the fair value of the biological assets amounted to EUR -0.1 (0.2) million INTERIM REPORT Q1/2018 8

9 Cash flow impacted by Rauma unit INTERIM REPORT Q1/2018 9
10 Estimated Rauma impact EUR -9,9 million in Q1/18 INTERIM REPORT Q1/

11 Net debt and gearing increased due to Rauma The Group s net debt at the end of March increased due to the Rauma poultry plant investment payments and its ramp-up costs. INTERIM REPORT Q1/
 INTERIM REPORT Q1/2018")
12 Debt profile and maturity structure well in balance Interest-bearing debt by credit type Maturity of Group s interest-bearing debt (EUR million) INTERIM REPORT Q1/
13 Outlook for 2018 (unchanged) Global meat consumption is projected to increase 1.6 per cent per annum during the coming years. Consumption growth is estimated to be led by poultry. There are also several value related consumption trends, which support HKScan s strategy implementation. In 2018, HKScan expects its strategy implementation to start recording results in terms of value growth in sales and operational efficiency in production. The Company will emphasize implementation of the From Farm to Fork strategy through the five focus areas which are Focus on meat, Leadership in poultry, Continue growing meals business, Cooperate with our farming community and Drive efficiency and costcompetitiveness. INTERIM REPORT Q1/

14 Thank you INTERIM REPORT Q1/

15 Strategy implementation proceeds Jari Latvanen, President and CEO 3 May 2018


16 HKScan has launched pork exports from Finland to China Targeted sales volume in China is roughly three million kg of pork within the first year, with plans to triple that volume by HKScan has founded a joint venture in China with Zhejiang Qinglian Food Co. Ltd to commercialise premium-category, valueadded products in China. The world-class expertise of Finnish pork producers will now be taken to a whole new level of added value. Q1, 2018

17 The first container has been shipped off The first container was shipped off on 23 April 2018 from Forssa. The kg shipment will travel by sea to Tianjin Port in China. The Chinese pork market is the world s largest. HKScan s key strengths in China are great flavour and the world-class expertise of Finnish family farms. Pork quality requirements in China are among the world s strictest. The Chinese consumers utilize all parts of the carcass in their cuisine. Our customers are interested in carcass parts that might be exotic from a European perspective, such as meaty bones and feet, which are highly valued and important ingredients in Chinese cuisine. Q1, 2018
18 Meat availability - Local production and self-sufficiency Self-sufficiency % = Own production / Consumption Pork Beef Poultry Finland 100% 82% 97% Sweden 70% 52% 67% Estonia 73% 127% 57% Share of local production out of consumed meat = (Own production - Export) / Consumption Pork Beef Poultry Finland 82% 78% 81% Sweden 62% 44% 59% Q1, 2018

19 HKScan to replace soymeal with domestic pulses in Kariniemen chain HKScan Kariniemen chicken farms will be the first in Finland to replace soy-based protein with domestic pulses such as broad beans in animal feed. Until now, animal feed has had to be supplemented with soymeal due to its high protein content. Renewing the diet of chicken will further increase domestic self-sufficiency of the chain. Result of long collaboration between HKScan s animal feed experts, contract farmers and feed producer partners. Q1, 2018

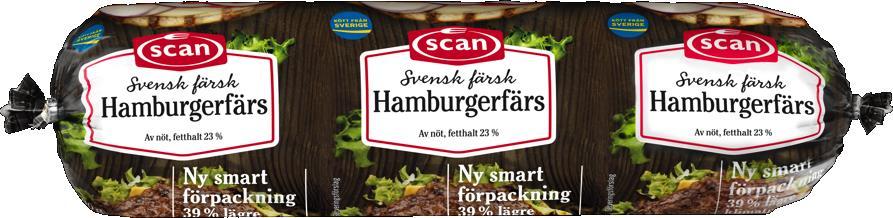
20 Tastes of the summer 2018 Q1, 2018


21 Sweden Q1, 2018


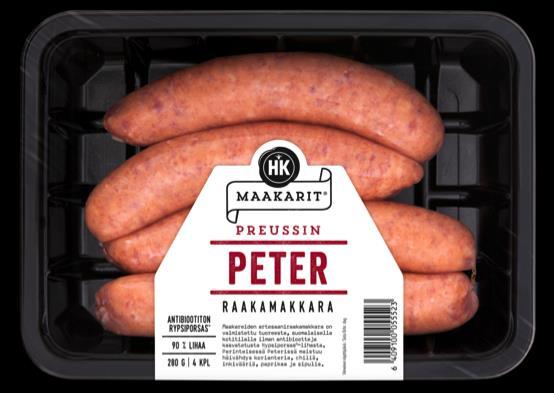

22 Finland Q1, 2018


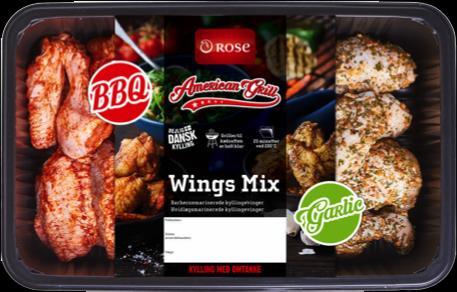

23 Denmark Q1, 2018


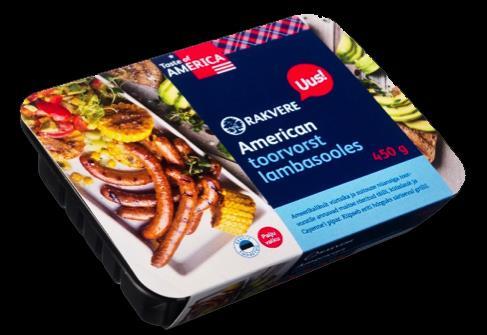
24 Baltics Q1, 2018

25 Kati Rajala, EVP Market Area Finland Managing Director of Snellmanin Kokkikartano Oy and Head of ready-made food division at Snellman Group Director, Operations Development and Support at Fazer Food Services Oy Development Manager, Production Solutions at Fazer Food Services Sourcing Manager, Indirect Services at Fazer Group Senior Consultant at Synocus Oy Q1, 2018

26


27 Fresh, authentic and tasty packages Product range feb and two salads for the summer.

28

29
30 Improving our productivity and cost competitiveness Sami Sivuranta, EVP Operations

31 Must win battle number 2 1Cooperate with our farming community 2 Drive efficiency and cost competitiveness 1. One HKScan in Operations 3 Focus on meat 2. Operational Excellence 3. Sales & Operations Planning process development capacity management 4 Leadership in poultry 4. Quality and Safety 5. Footprint and strategical investments 5 Continue growing meals business 6. Rauma ramp-up
 organisation Process ownership and responsibility of facilitation and follow-up.")
32 ONE Plan Structured approach Clear targets Executable activities with clear responsibilities, milestones and schedules Tight and constant follow-up LEAN principles adopted Operational (line) organisation Program ownership and responsibility of activities, execution and deliverables. Development (matrix) organisation Process ownership and responsibility of facilitation and follow-up. Resource allocation through prioritisation Q1, 2018
33 Group-wide roll-out with three focus areas ONE HKSCAN DRIVE FACTORY EFFICIENCY - Implement uniform KPI system - Accelerate focus on continuous improvements OPTIMISE CAPACITY FOOTPRINT - Increase flexibility and rationalise structure - Support growth opportunities EXCEL IN MEAT BALANCING FROM FARM TO FORK - Implement new demand-supply management model - Strengthen long term planning Q1, 2018
34 Sales and operations planning is the core of our planning process Links strategic business planning and daily execution Demand review STRATEGIC Executive S&OP meeting TACTICAL Supply review OPERATIONAL EXECUTION S&OP balancing Demand-supply balancing STRATEGIC BUSINESS PLANNING (LONG-TERM) Quarterly/annual cycle 1-5 year horizon TACTICAL S&OP (MID-TERM) Monthly cycle 3-18 month horizon OPERATIONAL S&OP (SHORT-TERM) Weekly cycle 2-13 week horizon EXECUTION (DAY-TO-DAY) Daily 0-2 week horizon Sales & Operations Planning (S&OP) Q1, 2018


35 The Rauma state-of-the-art poultry unit supports HKScan s strategy implementation in several ways HKScan has acquired the most modern technology on the market, which enables development of innovative Kariniemen novelties. Environmental responsibility taken into account in planning and acquisitions. New technology and production lines minimise total emissions. The investment supports employment Employees occupational health and wellbeing are being prioritised. Attention to animal welfare. Less handling phases. Birds are being transported max 70 km in average. Circular economy targets play an important role. Improved collection and utilisation of side streams. Q1, 2018
36 Rauma delivery capability development Q1/ % 100% 90% 80% 70% 60% 50% 40% 30% 20% 10% 0% 72,5 % 85,9 % 96,4 % Delivery capability % Delivery capability %, target Q1 / 2018 Q1, 2018

37 Rauma Priorities 2018 Q1 Stabilisation of delivery certainty and capability Q2 Consolidation of volumes to Rauma Q3 and Q4 Focus on efficiency and performance Q1, 2018

38 Thank you Q1, 2018