Insights from Process Based Crop Model, GLAM: Wheat Yield Hindcasts and Projections over Ethiopia
|
|
|
- Mervin Little
- 5 years ago
- Views:
Transcription

1 African Weather and Climate: Unique Challenges and Application of New Knowledge NCAR/UCAR, Boulder Aug. 2, 2011 Insights from Process Based Crop Model, GLAM: Wheat Yield Hindcasts and Projections over Ethiopia Gizaw Mengistu, Dept. of Physics, Addis Ababa University, Ethiopia
2 OUTLINES I) Introduction II) General Large Area Model for annual crops (GLAM) III) Optimizing Regional Climate Model IV) GLAM Calibration and Validation for Spring Wheat over Ethiopia V) GLAM Projections of Spring Wheat Yield: GDFL CM2.1, A1b scenario VI) Summary


3 Climate Change SOURCE:IPPC

4 Climate Change

5 Climate Change Impact on Agriculture 70% of the global land use is agriculture, rangeland and forestry for Agriculture remains the major source of livelihoods of majority of world s rural poor. - For example, agriculture accounts for 70% of full-time employment in Africa, 33% of total GDP, and 40% of total export earnings. Climates factors directly agricultural productivity: affect -Change in temperature -Change in rainfall amount and patterns -Rising atmospheric [CO2] -Change in climatic variability and extreme events The climate factors impact different stages of crop development: emergency, flowering, graining filling, harvest. The time-span of each development phase depends on genotype, temperature, daylength and sowing date
6 Application of crop model Understand the plants, soil, weather and management interactions Predict crop growth, yield, timing Risks assessment and investment support Optimize Management using Climate Predictions Global climate change and crop production
7 Application of crop model James Verdin, 2005
8 Application of crop model Crop model at the field level Could be a good option to understand how climate factors affect crop development but involves: High input data Complexity of incorporating the spatial variability of input Climate model output which is coarse compared with input to crop mode To overcome this limitation, crop model of domain comparable to GCM or RCM are coming up: e.g. General Large Area Model for annual crops (GLAM; Challinor et al, 2004)
9 General Large Area Model for annual crops (GLAM) combines the benefits of more empirical approaches (low input data requirements, validity over large spatial scales) with the benefits of capturing intra-seasonal variability, and so cope with changing climates) LI Sanai et al, 2010
10 Crop model-inputs and outputs Input Daily weather -Rainfall -Tmax -Tmin -Solar radiation parameters -soil physics, -crop varieties -phenology, etc Output GLAM Soil water balance Leaf canopy Root growth Biomass Yield production
11 Simulation of developmental stages daily effective temperature (oc) Time (days) t TT = T eff T b dt i development stage thermal time ( Cd) o base temperature (oc) Once the thermal time accumulation ttt reaches the specified thermal time for a given stage, next stage begins
12 The response of the simulated growth duration to increase in temperature

13 Modelling growth: photosynthesis Photosynthesis: A chemical process by which a plant turns light energy from the sun into chemical energy in the form of sugar. Courtesy: LI Sanaii

14 Modelling growth: biomass Biomass=RUE* intercepted solar radiation RUE normally increases with more N RUE decreases by significant stress e.g. water van Ittersum, 2003

15 Water Balance in crop model Rain Evaporation + Transpiration Runoff Sw=Train-Ttran-Tevap-Trun-Tdrain
16 Crop Yield (Y) from GLAM Crop yield is simulated as the product of accumulated biomass (W) and the harvest index (ratio of grain yield to biomass): Y=HI*W High temperature impact is also accounted using a threshold critical temperature.
17 Model Calibration and validation Calibration measuring (direct) or fitting (indirect) model parameters to observed data Validation using independent observed data for testing model skills Climate model data is widely used as observational daily data are limited both spatially and temporal.


18 Can Climate model capture diversity and variability climate? Complex topography Topography play significant role in climate.


19 One of the option: Blending satellite data with station data Less spatial Conventional coverage station Satellite data smooths out peak rainfall data Better estimation and spatial coverage Courtesy: Kinfe H/Mariam, 2011 Blended

20 Regional Climate Model Domain for Numerical Experiment


21 Regional Climate Experiment: Domain choice has taken into account mean major weather producing systems

22 Regional Climate Experiment: Our Analysis Domain
23 Regional Climate Experiment: Convective Schemes
24 Regional Climate Experiment: Convective Schemes

25 Regional Climate Experiment: Convective Schemes
26 Modified Grell FC parameters selection scheme with new
27 Modified Grell FC parameters selection scheme with new

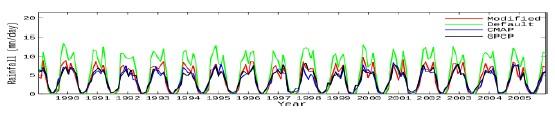
28 Modified Grell FC parameters selection scheme with new


29 GLAM Calibration and Validation for Spring Wheat: Spring wheat growing regions Courtesy: FAO
30 GLAM Calibration and Validation for Spring Wheat Over Amhara regional state of Ethiopia
31 GLAM Calibration and Validation for Spring Wheat: Absolute detrend yield to remove difference in technology, management etc North Shewa Zone Yield (kg/hectare) Yield (kg/ha) Regression Detrended absolute Yield Year Yield (Kg/hectare) South Wollo Zone Yield (kg/ha) Regression Detrended absolute Yield Year
 Weather")

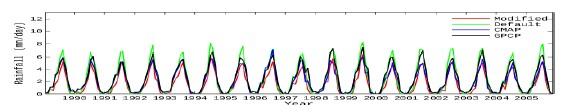
32 GLAM Calibration and Validation for Spring Wheat: (I) Weather inputs from Default Grell FC run Observed Yield, 2008 Simulated Yield, 2008
33 GLAM Calibration and Validation for Spring Wheat: (I) Weather inputs from Default Grell FC run
 Weather inputs")

34 GLAM Calibration and Validation for Spring Wheat: (II) Weather inputs from GPCP ppt+improved Tmin, Tmax, srad Observed Yield, 2008 Simulated Yield, 2008
35 GLAM Calibration and Validation for Spring Wheat: (II) Weather inputs from GPCP ppt+improved Tmin, Tmax, srad
 Weather inputs")

36 GLAM Calibration and Validation for Spring Wheat: (III) Weather inputs from New Grell FC parameters run Observed Yield, 2008 Simulated Yield, 2008
37 GLAM Calibration and Validation for Spring Wheat: (III) Weather inputs from New Grell FC parameters run
38 GLAM Calibration and Validation for Spring Wheat:Correlation Correlation between and observed and simulated yield has improved by 12% old parameter set and from GPCP by 5%
39 GLAM Projections of Spring Wheat Yield: GDFL CM2.1 runs for A1b scenario Climate change impact on plant growth can broadly be categorized as direct (CO2 effect) and indirect (through changes in PPT, Temp., radiation) We have 5 cases to consider: 1) Indirect- changes in weather variables in GCM projection; 2) Direct- CO2 induced change in TE and max. Transpiration Rate as confirmed from controlled experiment; 3) Direct- CO2 induced high changes in TE & max. Transpiration Rate; 4) Indirect- Change in optimum temp. as a result of development response to high temperature; 5) Adaptation: Improvement in use of nutrient, land management etc
40 Indirect- changes in weather variables in GCM projection Top:areal ave. time series; Bottom(left): Obs. Mean yield; Bottom(right):Depar ture in (%) of the mean projection
 Top:areal ave. time series; Bottom(left): Obs.")
41 Direct- CO2 induced change in TE (24% increase) and max. Transpiration Rate (5% decrease) Top:areal ave. time series; Bottom(left): Obs. Mean yield; Bottom(right):Depar ture in (%) of the mean projection
 Top:areal ave. time series; Bottom(left): Obs.")
42 Direct- CO2 induced change in TE (100% increase) and max. Transpiration Rate (30% decrease) Top:areal ave. time series; Bottom(left): Obs. Mean yield; Bottom(right):Depar ture in (%) of the mean projection

: Obs.")
43 Indirect- Change in optimum temp. as a result of development response to high temperature (3 degree centigrade increase) Top:areal ave. time series; Bottom(left): Obs. Mean yield; Bottom(right):Depar ture in (%) of the mean projection
: Obs.")
44 Adaptation: Improvement in use of nutrient, land management (reduce current yield gap by 3%) Top:areal ave. time series; Bottom(left): Obs. Mean yield; Bottom(right):Depar ture in (%) of the mean projection

45 GLAM Projections of Spring Wheat Yield: All cases
46 Crop yield change (%) for per 1 oc rise in temperature Location Crop Yield change(%) Global ( ) Wheat, Barley, rice,maize, Soybean, Sorghum -0.6 to -8.9 Lobell and Field, 2007 Philippines ( ) Rice -10 Peng et al., 2004 United States ( ) Corn, soybean -17 Lobell and Asner, Tao et al., 2006 Tianshui,China Wheat ( )
47 GLAM Projections of Spring Wheat Yield Process based Crop modeling allows to investigate what key processes are affected by climate change. For instance:1) How water use efficiency of the plant responds to all of the above cases; 2) How RUE of the plant evolve under climate change; 3) How the growing period of the plant is altered; etc 4) Adaptation option including genetically enhancing RUE, TE etc can be formulated based on knowledge acquired through process studies 5) Moreover, crop model is vital for early warning and risk reduction and management.
48 GLAM Projections of Spring Wheat Yield: Drought mitigation and adaptation Avoid stress at sensitive stages-floral initiation and pollination Adjusting planting structure or sowing date Seed Engineering-choice of cultivar tolerance to drought Rainfall collection based water saving Membrane coverage increase the CO2 gradient between the atmosphere and the inside of leaves, Increase rate of photosynthesis increase growth rate and productivity of plants decrease transpiration increase crop water use efficiency and yield
49 Summary Climate models needs to be optimized to capture diverse and highly variable local climate GLAM can be used for both hindcasts and projections Adaptation options can be formulated from process understanding There is still more to be done to improve the correlation between observed and simulated wheat yields.
50 GLAM EXERCISE 1) You will find working directory called GLAM on your work station 2) Under GLAM, you will find 6 folders, 2 doc and 1 pdf files plus matlab code, 'GLAM_ANALYSIS.m' for GLAM experiments 3) The pdf file will guide you how to perform your experiment.