IS SMALL STILL BEAUTIFUL? THE FARM SIZE-PRODUCTIVITY RELATIONSHIP REVISITED
|
|
|
- Priscilla Brown
- 5 years ago
- Views:
Transcription

1 IS SMALL STILL BEAUTIFUL? THE FARM SIZE-PRODUCTIVITY RELATIONSHIP REVISITED Milu Muyanga & T.S. Jayne Agricultural, Food and Resource Economics Department Michigan State University, USA Presented at the International Conference on Ecosystem Resilience and Agricultural Productivity November 23, 2017, Speke Resort Munyonyo, Kampala Uganda


2 Acknowledgements: The work highlighted here is jointly funded through the generous support of the American people through the United States Agency for International Development (USAID) under the Food Security Policy Innovation Lab and by the Bill and Melinda Gates Foundation under the Guiding Investments in Sustainable Agricultural Intensification Grant to MSU.
3 25 Introduction Smallholder farms constitute about 70% of farms in Africa, and majority of them are poor and food insecure Based on evidence from Asia, it is generally accepted that a smallholder-led strategy holds the best prospects for achieving structural transformation and mass poverty reduction in Africa
4 Standard version of the structural transformation model (Mellor, 1976; Johnston and Kilby, 1975) 34
5 CONCERNS about the viability of a smallholder-led growth strategy in Africa 1. Small-scale farming in Africa has historically provided very LOW RETURNS to labor 2. Mounting POPULATION pressure and shrinking FARM SIZES 3. UNSUSTAINABLE forms of agricultural intensification with population growth 4. Changing FARM STRUCTURE-- rising proportion of land among medium-scale farms (5-100 hectares) 24
6 Sub-Saharan Africa: only region of world where rural population continues to rise past Total Rural Population (millions) China India Sub Saharan Africa Other South Asia South East Asia Source: UN 2013


7 5 Agricultural intensification- Kenya Sustainable intensification Source: Tegemeo Institute Panel Data, Kenya
8 4 Intensification tends to plateau at about persons/km 2 Figure 4: Net crop income per hectare cultivated '000KSh Sustainable intensification Unsustainable intensification actual simulated 25% 50% 75% 95% Source: Tegemeo Institute Panel Data, Kenya persons/sq km
9 Changes in farm structure in Tanzania ( ), LSMS/National Panel Surveys Farm size Number of farms (% of total) % growth in number of farms between initial and latest year % of total operated land on farms between ha ha 5,454,961 (92.8) 6,151,035 (91.4) % 5 10 ha 300,511 (5.1) 406,947 (6.0) ha 77,668 (1.3) 109,960 (1.6) % ha 45,700 (0.7) 64,588 (0.9) Total 5,878,840 (100%) 6,732,530 (100%)

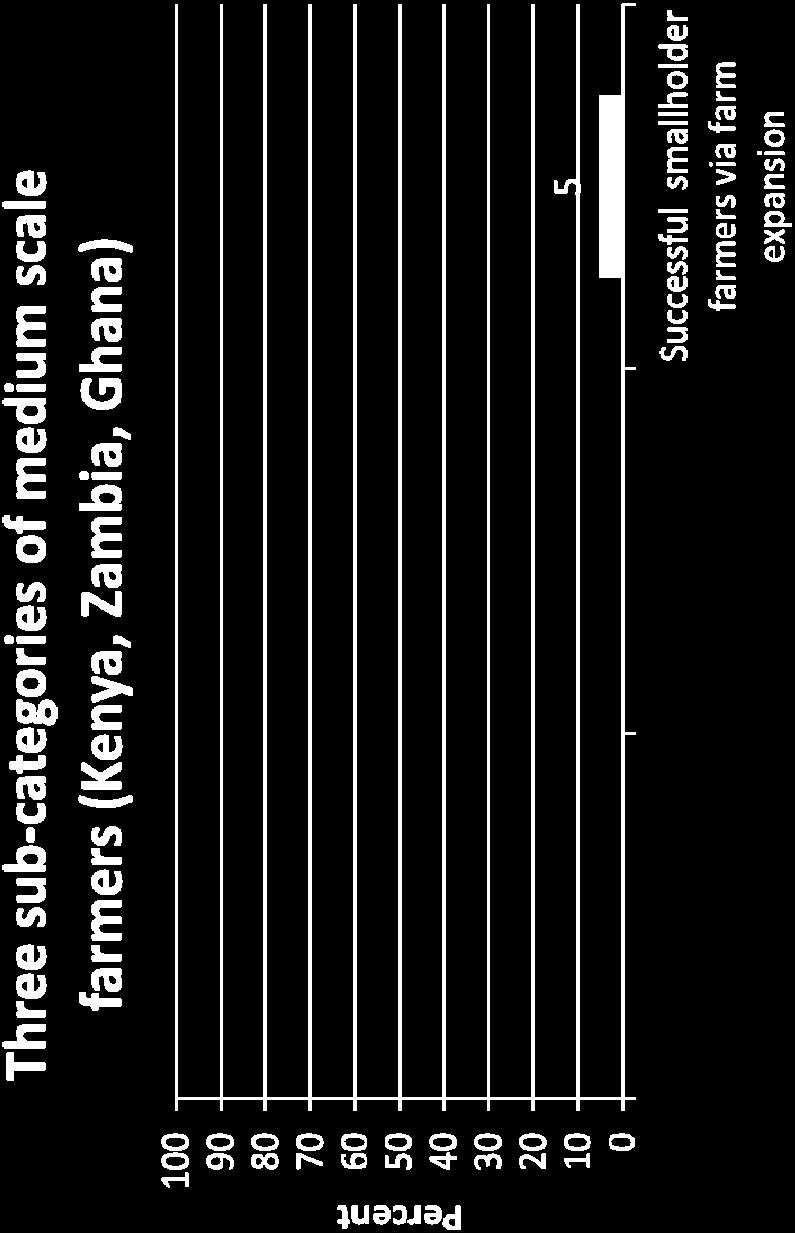

10 Rise of the medium-scale farmers

11 Rise of the medium-scale farmers

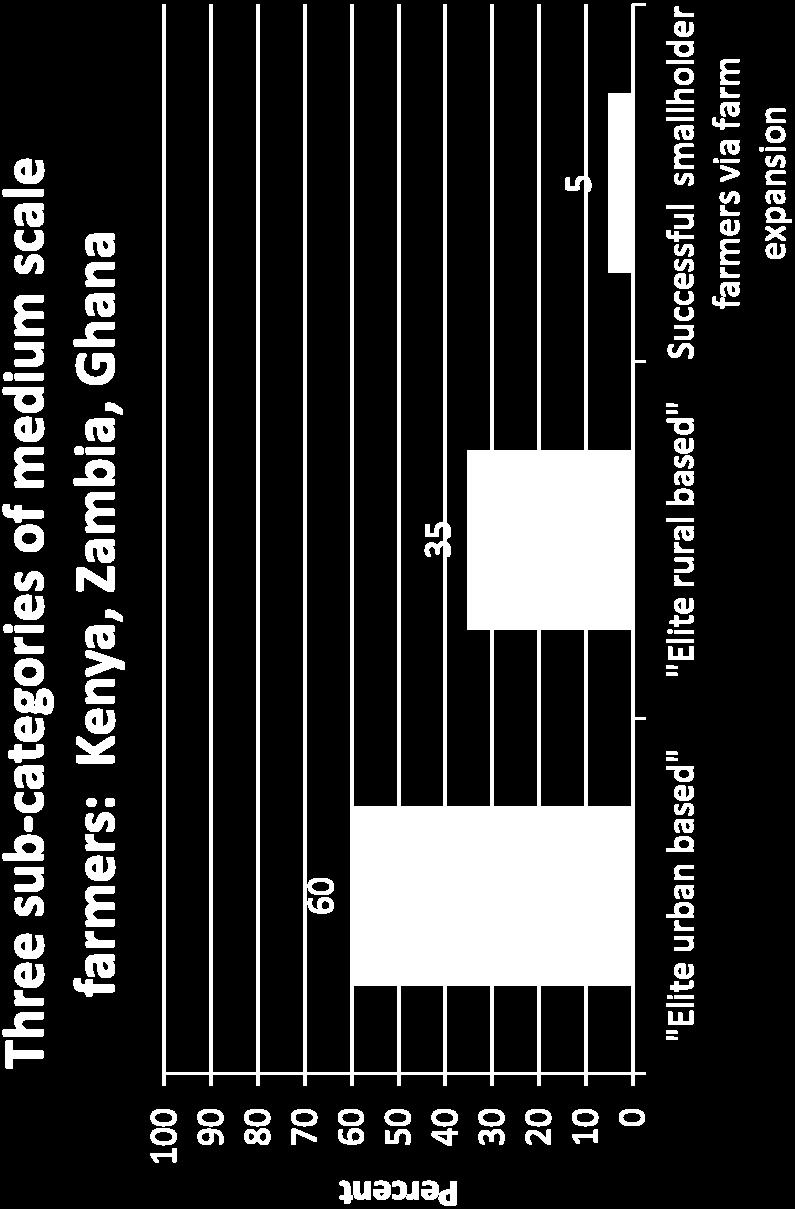


12 Rise of the medium-scale farmers
13 % of National Landholdings held by Urban Households 35% 32.7% 30% 26.8% 25% 22.0% 22.0% 20% 18.3% 16.8% 15% 10% 11.2% 10.9% 11.8% 5% 0% / /2014 Ghana Kenya Malawi Rwanda Tanzania Zambia Source: Demographic and Health Surveys, various years between
14 23 These CONCERNS seem incongruous, at least on the face of it, with research findings that small farms are relatively more productive than larger farms Thus, renewed interest in the Inverse Farm Size- Efficiency Relationship (IR) among development economists
15 22 Tests of the IR hypothesis take on even greater policy importance in light of recent studies questioning the viability and even the objectives of promoting smallscale agriculture in Africa Favoring small farmers is romantic but unhelpful [Collier and Dercon, 2014]
16 21 Contribution 1. Explore the IR hypothesis over a much wider range of family managed farm ranging between 0 and 100 ha 2. Study is based on a wider set of productivity and profitability measures 3. Account for both variable and fixed costs when computing the cost of production that earlier studies may have overlooked
17 20 Methods [I] Use neo-classical production function approach Farm output or productivity depends on land and labor Dependent variable ( ): measure of agricultural productivity, profitability, return on family labor Gross/net value of output per operated farm size Total factor productivity, computed following Li et al. (2013) Productivity index: gross value of crop output/production costs Gross/net value of output per unit of family labor is the planted area- our variable of interest
18 18 Data sources and analysis Data came from about 500 households both smallholders and medium-scale farms Data analysis: Descriptive, Non-parametric regressions Econometric regressions
19 Descriptive & Econometrics Results
20 Bivariate results [I] Figure 1: NPR results in the full sample 15 '000KSh/ha planted hectares planted Gross value- all crops Net value- all crops Gross value- maize crop Net value- maize crop '000KSh/ha planted hectares planted All crops Maize crop Figure 2(a): Value of crop production/ha planted Figure 2(b): Total factor productivity gross crop value/total costs hectares planted All crops Maize crop '000KSh/resident adult hectares planted Gross value- all crops Net value- all crops Gross value- maize crop Net value- maize crop Figure 2(c): Gross value of crop /total production costs Figure 2(d): Gross value of crop production per resident adult Notes: Non-parametric regression using Nadaya-Watson Approach, bandwidth=8
21 Descriptive results [II] Figure 2: NPR results in smallholder farms 14 '000KSh/ha planted hectares planted Gross value- all crops Net value- all crops Gross value- maize crop Net value- maize crop '000KSh/ha planted hectares planted All crops Maize crop Figure 2(a): Value of crop production/ha planted Figure 2(b): Total factor productivity gross crop value/total costs hectares planted All crops Maize crop '000KSh/resident adult hectares planted Gross value- all crops Net value- all crops Gross value- maize crop Net value- maize crop Figure 2(c): Gross value of crop /total production costs Figure 1(d): Value of crop production per resident adult Notes: Non-parametric regression using Nadaya-Watson Approach, bandwidth=0.8
22 Descriptive results [IV] Figure 4: NPR results of crop production costs 13 '000KSh/ha planted hectares planted '000KSh/ha planted hectares planted Using local ag wage Using shadow labor price Using local ag wage Using shadow labor price Figure 4(a): Aggregate production costs/ha planted Figure 4(b): Disaggregated production costs/ha planted % of total labor cost hectares planted Family labor Salary labor Casual labor '000KSh/ha planted hectares planted Fertilizer Seed Land preparation Labor Fixed costs Land rent Figure d(c): Labor costs/ha planted Figure 3(d): Disaggregated labor costs /ha planted Notes: Non-parametric regression using Nadaya-Watson Approach, bandwidth=8
23 Econometrics Results Table 4: OLS Regression Estimation Results of Land Productivity 12 Dependent variable: Gross value of crop production/ha 000KSh Net value of crop production/ha 000KSh Model: Model Model Model I(d) Model II(a) Model II(b) I(a) I(b) Ha planted 1.61 *** 0.83 *** 1.87 *** 2.41 *** 2.01 *** Sq. ha planted *** *** *** *** *** Exogenous variables YES YES YES Inputs & management YES practices Household location YES YES YES YES YES dummies Sample (1=2012; 0=2010) _cons *** * *** Observations R Square Turning point (ha)
24 Table 5: OLS Regression Estimation Results of TFP and Productivity Index Dependent variable: Total factor productivity 000KSh Productivity index Model: Model I(a) Model I(b) Model I(d) Model Model II(b) II(a) Ha planted (ha) 0.10 *** 0.07 *** 0.11 *** 0.03 *** 0.03 *** 11 Sq. ha planted *** *** *** 0.03 *** 0.03 *** Exogenous variables YES YES YES Inputs & management YES practices Household location YES YES YES YES YES dummies Sample (1=2012; 0=2010) _cons 4.32 *** *** 0.06 Observations R Square Turning point (ha)
25 Table 6: OLS Regression Estimation Results of Return on Family Labor Dependent variable: Gross value of crop production/ha 000KSh Net value of crop production/ha 000KSh Model: Model I(a) Model I(b) Model I(d) Model II(a) Model II(b) 10 Ha planted (ha) *** *** *** *** *** Sq. ha planted 0.13 *** 0.14 *** 0.13 *** 0.15 *** 0.15 *** Exogenous variables YES YES YES Inputs & management YES practices Household location YES YES YES YES YES dummies Sample (1=2012; 0=2010) _cons * Observations R Square Turning point (ha)
26 Table 7: OLS Regression Estimation Results of Land Productivity- SMALLHOLDER SUB-SAMPLE Dependent variable Gross value of crop production per ha planted 000KSh Net value of crop production per ha planted 000KSh Total factor productivity 000KSh Crop productivity index [crop value/total costs] Gross value of crop production/adult person 000KSh Net value of crop production/adult person 000KSh Model Ha planted (ha) Sq. ha planted Exogenous variables Inputs & management practices Turning point (ha) I(a) * 3.72 * I(b) * 4.36 * yes 3.00 I(c) * 2.48 * yes yes 2.78 II(a) *** 3.56 *** 2.8 II(b) *** 3.92 *** yes 2.85 III(a) *** 0.24 *** 2.96 III(b) *** 0.26 *** yes 3.01 III(c) *** 0.19 *** yes yes 2.91 IV(a) *** 0.25 *** 3.08 IV(b) *** 0.25 *** yes 3.10 IV(c) *** 0.20 *** yes yes 3.06 V(a) *** 0.96 *** V(b) *** 1.00 *** yes V(c) ** 0.95 ** yes yes VI(a) ** 1.73 ** 0.69 VI(b) ** 2.00 ** yes
27 3 Conclusions 1. Small may NOT be necessarily beautiful any more May be farm sizes have become too small and too degraded to generate any meaningful surplus May be medium-scale farms are now able to overcome diseconomies of scale challenges We have reasons to believe that capitalized and educated MS farms are likely to be more productive 2. Production efficiency, while relevant, should not be the ONLY factor in guiding agricultural and land policies 3. Should government policy support small or medium farms?
28 2 Conclusions 1. Small may NOT be necessarily beautiful in family managed farms May be farm sizes have become too small May be medium-scale farms are now able to overcome scale challenges 2. Production efficiency, while relevant, should not be the ONLY factor in guiding agricultural and land policies Especially in countries where over 70% of farming households are smallholders and are poor Which scale has the largest multiplier and employment effects? 3. Should government policy support small or medium farms?
29 1 Policy implications 1. Production efficiency, while relevant, should not be the ONLY factor in guiding agricultural and land policies 2. All depends on the government s development objective: 3. Should government policy support small or medium farms? All depends on the government s development objective and land resource endowment: Production for domestic food self sufficiency and export market? Broad based growth for reduced food insecurity and poverty reduction?


30 30 Thank You