Soybeans try to avoid a $7 handle U.S. prices are cheap, but could get cheaper By Bryce Knorr, senior grain market analyst
|
|
|
- Lucas Anthony
- 5 years ago
- Views:
Transcription
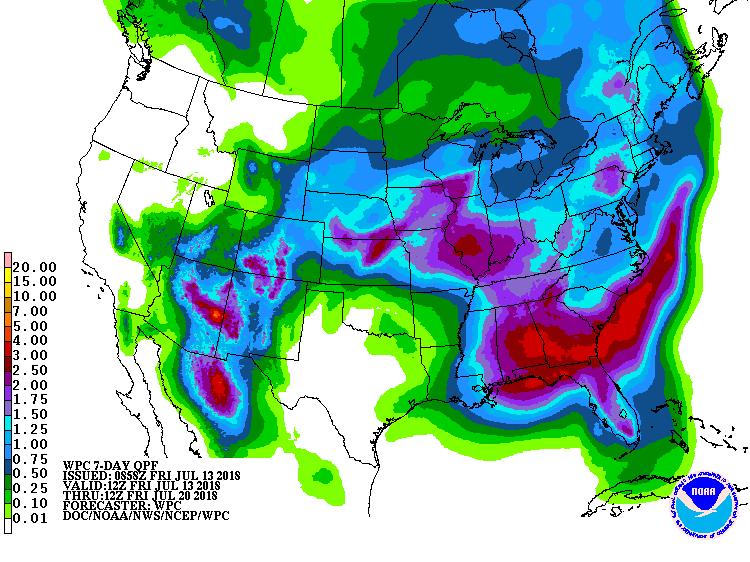
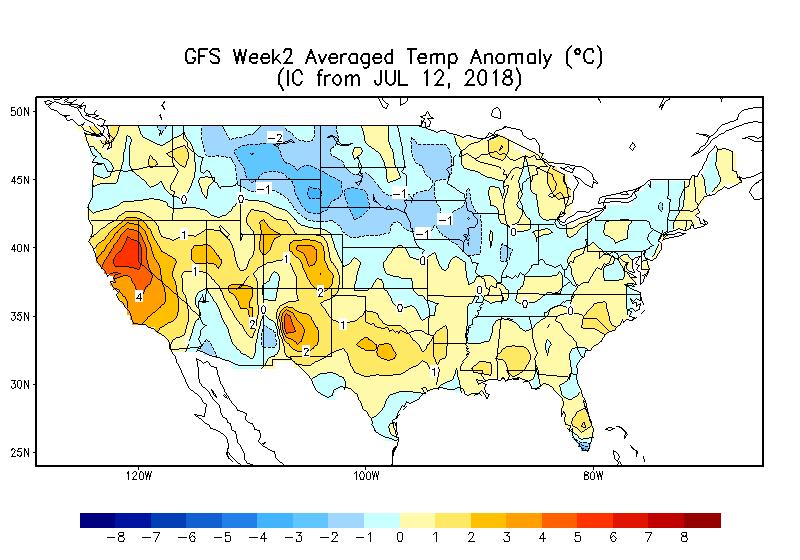
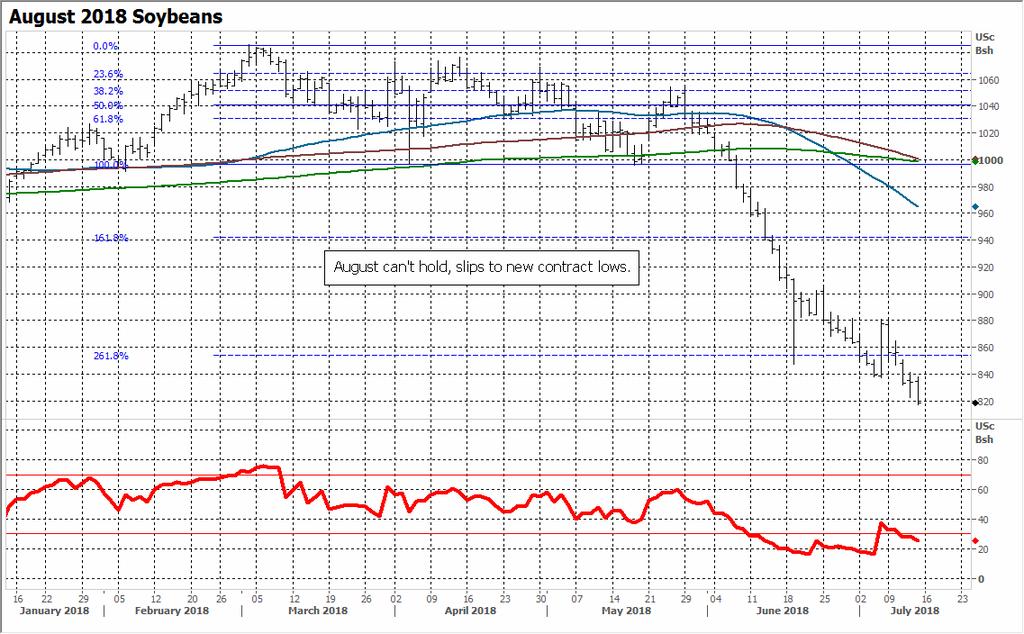
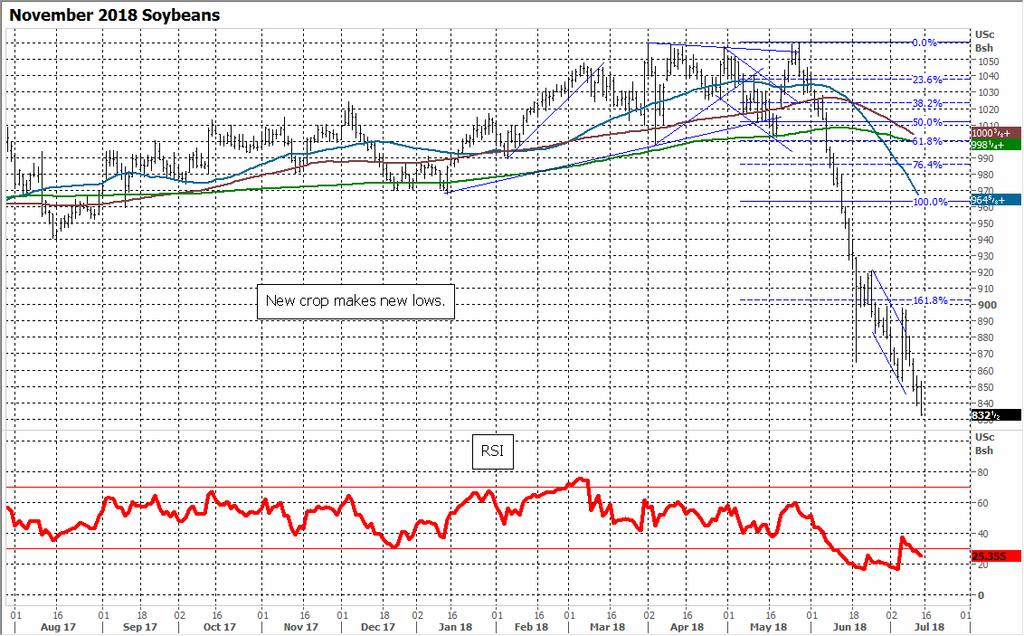
1 Soybeans try to avoid a $7 handle U.S. prices are cheap, but could get cheaper By Bryce Knorr, senior grain market analyst In early July before China s tariffs on soybeans went into effect I wrote that hoping for a rally was akin to drawing to an inside straight or pulling a rabbit out of a hat. Indeed, the aftermath of the first weeks of the trade war shows beans hand a bust, with no magic to stop the steady drop in prices. To be sure, there s always hope that negotiations will lead to a breakthrough that ends the dispute. But with futures at the lowest level since 2008, growers face a long ways back to profitability. USDA s July 12 monthly report put a number on the lost revenue farmers face: $325 million in new crop sales. That number is based on the amount the agency lowered its price range for crop, 75 cents a bushel. The July report featured USDA s first attempt to quantify what the tariffs mean for U.S. exports, and it s not pretty. Chinese buyers face higher prices that will discourage their overall demand, which was already soft from a weakening economy and money-losing livestock sector. USDA agreed with the Chinese government s assessment that total Chinese soybean imports will fall around 2% from 2017 levels, and nearly 8% from their original rosy estimate. On the plus side, some of those soybeans will ultimately come from the U.S. if current trends continue. U.S. fall prices out of the Gulf are 20% lower than those out of Brazil, and cheaper freight could help close the 25% tariff gap. Low prices are also encouraging demand from other customers swooping in to secure deals. The book of old crop unshipped sales is at a record level for this time of year. China has 25 million bushels of those 263 million that likely will be cancelled or perhaps switched to other destinations. USDA may be a little optimistic in its forecast for the amount of supplies leftover Sept. 1 unless the pace of shipments is seasonally torrid for the next two months. But 10 to 20 million bushels won t make much difference at this point. It s tough to argue with the agency s forecast for new crop carryout of 580 million bushels, which would be an all-time record if it holds. And that total could climb higher if the crop gets bigger. USDA stuck to its trend yield of 48.5 bushels per acre in July. But crop ratings suggest another year of above average yields is possible. June weather data shows stress was apparent in several key states due to too much or two little rainfall. But forecasts don t look especially threatening for the rest of July, making August weather as usual critical. And there s a mild correlation between El Nino conditions in the fall and above average soybean yields likely boosted by increase late growing season rains. If production doesn t swell too much, November futures may try to hold the $8 level into the August report. USDA put the bottom of its average cash price for the 2018 crop at $8, a level already reached in many local markets around the country. It s still a $2 climb back to profitability. But most growers appear to have priced a good chunk of their expected production when offered a good price this winter and spring. Still, price charts suggest darker potential. Fibonacci projections were taken out on the break to new contract lows in July, with the next objective down around $7. To $7.10. These extreme waves aren t normally reached, but these times aren t like most times either.
2 Soybean Supply & Demand Area Average 2018 Big Crop Planted 90,142 89,557 90,142 89,557 89,557 Harvested 89,522 88,900 89,522 88,716 88,716 Yield Beginning stocks Production 4,392 4,310 4,393 4,253 4,513 Imports Supplies, total 4,715 4,800 4,715 4,770 5,030 Crushings 2,030 2,045 2,018 1,964 2,014 Exports 2,085 2,040 2,062 2,081 2,172 Seed Residual Use, total 4,251 4,220 4,225 4,169 4,317 Ending stocks Ave. cash price $9.40 $9.25 $9.07 $8.57 $8.14 Ave. nearby fut. $9.71 $9.16 $8.70 (To-Date) $9.89 Stocks to use 10.9% 13.7% 11.6% 14.4% 16.7% Top Third of Price Range USDA $10.53 to $11.36 Bryce $9.95 to $10.73 $9.45 to $10.20
3 OTHER, 19% LEADING SOYBEAN EXPORT COMMITMENTS YEAR TO DATE JULY 5, 2018 TAIWAN, 3% NETHERLANDS, 4% EGYPT, 4% CHINA, 49% JAPAN, 4% INDONESIA, 4% UNKNOWN, 6% MEXICO, 7% EUROPEAN UNION, 7%
4 10% CHINESE SOYBEAN IMPORTS RISE BUT NOT FROM U.S CROP YEAR VS PREVIOUS YEAR 5% 0% -5% 4% 4% -22% -10% -15% -20% -25% USDA Forecast For 2017 crop Chinese Imports All China Imports Through May U.S. Commitments to China (7/5/18)


5 Projected U.S. Soybean Yields /4 6/18 7/2 7/16 7/30 8/13 8/27 9/10 9/24 10/8 10/22 State Model State model -- last year U.S. Model
6
7
8 Projected Iowa Soybean Yields ` /4 6/18 7/2 7/16 7/30 8/13 8/27 9/10 9/24 10/8 10/22 Cur re nt year Last year Projected Illinois Soybean Yields /4 6/18 7/2 7/16 7/30 8/13 8/27 9/10 9/24 10/8 Cur re nt year Last year
9 Projected Indiana Soybean Yields /4 6/18 7/2 7/16 7/30 8/13 8/27 9/10 9/24 10/8 10/22 Cur re nt year Last year
10
11
12 Weekly Export Inspections in million bushels For week of 07/05/18 This Week Last Week Average Trade Guess This Week Last Year Rate Needed to Meet USDA Forecast Year-to- Date Total This Year Year-to- Date Total Last Year WHEAT CORN ,859 1,958 SOYBEANS ,850 1,948 Source: USDA, Reuters Thousand Bushels 120, , ,000 90,000 80,000 70,000 60,000 50,000 40,000 30,000 20,000 10,000 0 Weekly Soybean Export Inspections S O N D J F M A M J J A Yr. Avg. Other, 3.3 SOYBEAN EXPORT INSPECTIONS WEEK ENDING JULY 5, 2018 Million bushels Malaysia, 1.1 Mexico, 1.2 Uae, 1.6 Egypt, 8.1 China, 2.5 Indonesia, 3.5 Taiwan, 3.2
13 1,000 MT Soymeal Export Commitments 12,000,000 11,000,000 10,000,000 9,000,000 8,000,000 7,000,000 6,000,000 5,000,000 4,000,000 3,000, Year Average 2,000,000 Weekly Export Sales (million bushels) AS OF WEEK ENDING 7/5/18 Wheat Corn Soybeans Old Crop Sales New Crop Sales Total Sales Prior Week Trade Estimates Rate to reach USDA Forecast (Old Crop) (5.7) Export Shipments Rate to reach USDA Forecast Commitments % of USDA estimate (Old Crop) 34% 97% 99% 5-year average for this week 31% 96% 100% Shipments % of USDA est. 11% 72% 85% 5-year average for this week 8% 75% 92% Source: USDA, Reuters
14 Million bushels Total Soybean Shipments (Year To Date) 100.0% 95.0% 90.0% 85.0% 80.0% 75.0% 70.0% Total Shipments % of USDA Forecast Million Bushels Total Soybean Sales & Shipments (Year to Date) 104% 102% 100% 98% 96% 94% 92% 90% 88% Total Commitments % of USDA Forecast
15 Unshipped Soybean Sales Million Bushels Final exports Next Year's Soybean Sales (Year to Date) Final Exports New crop sales New crop sales 2,500 2,000 1,500 1, SOURCE: USDA.
16
17 $2.50 CBOT Crush Margin $2.00 $1.50 $1.00 $0.50 $- 1/3/2014 1/3/2015 1/3/2016 1/3/2017 1/3/2018
18 35% World soybean stocks to use 30% 25% stocks to use 20% 15% 10% 5% 0% 30% U.S. Soybeans Stocks/Use 25% 20% stocks/use 15% 10% 5% 0%
19 November Soybeans Seasonal Trends Non-Bull Years Bull Years Nov Nov net position in contracts Commitment of Traders - Soybeans $12.00 $11.50 $11.00 $10.50 $10.00 $9.50 $9.00 $8.50 nearby futures $8.00 1/15 4/15 7/15 10/15 1/16 4/16 7/16 10/16 1/17 4/17 7/17 10/17 1/18 4/18 7/18 Source: CFTC Index funds Hedge funds Futures
20 Commitment of Traders - Soybean oil net position in contracts nearby futures /15 4/15 7/15 10/15 1/16 4/16 7/16 10/16 1/17 4/17 7/17 10/17 1/18 4/18 7/18 Source: CFTC Index funds Hedge funds Futures Commitment of Traders - Soybean meal $ $400 net position in contracts $350 $300 $250 nearby futures $200 1/15 4/15 7/15 10/15 1/16 4/16 7/16 10/16 1/17 4/17 7/17 10/17 1/18 4/18 7/18 Source: CFTC Index funds Hedge funds Futures
21
22
23