Fundamental Shifts Impacting U.S. Agriculture
|
|
|
- Maximillian Miller
- 5 years ago
- Views:
Transcription

1 Fundamental Shifts Impacting U.S. Agriculture Richard Brock California Grain & Feed Association San Diego, CA April 28,


2 Game Changers 3 fundamental shifts Long term Impact


3 $2 cotton in 2011 industry will never be the same.

4 $8.00 corn in 2012 Research yield and drought resistant World Corn Production World Corn Exports billion bu billion bu 4.0 non U.S. 25 non U.S U.S. 15 U.S /96 00/01 05/06 10/11 15/ /96 00/01 05/06 10/11 15/16 0.0
5 Oil price collapse Fracking changed the world low oil prices for a long time period. OPEC Collapse Weekly Crude Oil Futures $/barrel

6 Other market impacts

7 Technology Transfer to Asia


8 Water Availability

9 Consumer Demand Shift

10


11 General Economy & Outside Markets

12 I personally would suggest government. They never go to jail

13 U.S. Dollar Index

14 U.S. Dollars per Brazilian Real
15 CRB Index vs. U.S. Dollar Index Commodity prices often move inversely the U.S. dollar. CRB Index U.S. Dollar Index
16
17
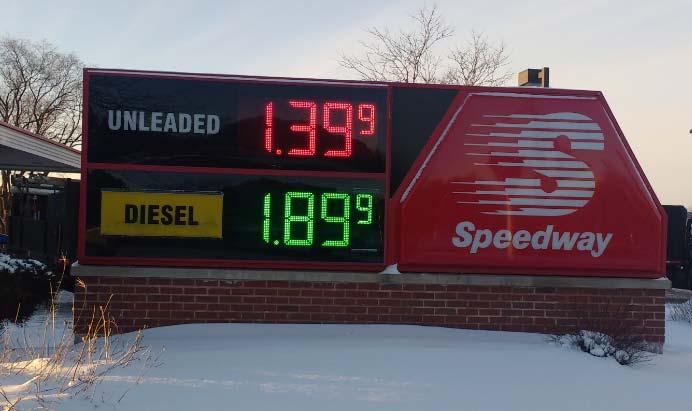
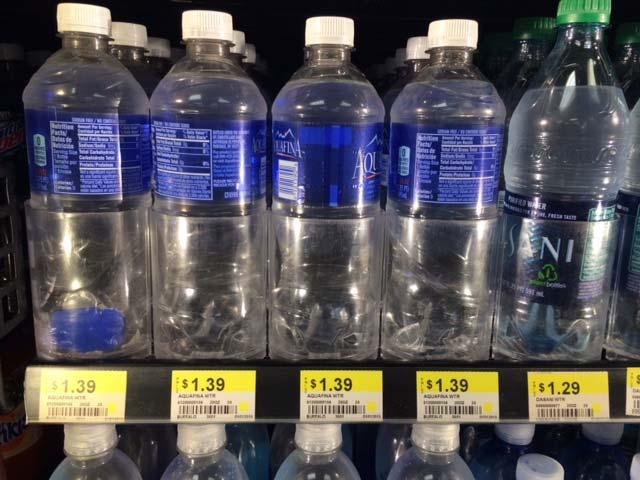
18 $1.39/20 oz. bottle = $8.90/gal Water is 6.4 times more expensive than gasoline!


19 Crude Oil, monthly continuous

20 June Crude Oil Shale oil regions
21 U.S. Crude Oil Inventory 2015 Million barrels average range Source: EIA As of April 15th, crude oil inventory was: 10% above last year, 34% above 5-year average Jan Feb Mar Apr May Jun Jul Aug Sep Oct Nov Dec
22 12 U.S. Crude Oil Production and Imports Million barrels/day Imports down 28% since 2006 peak Production down 6.4% from June peak Domestic production up 127% since 2008 bottom Source: EIA through April 15, ; values based on 4-week moving averages
23
24 Farm Economy

25 7 Stages of Agricultural Economic Cycle 7 Stages of Ag Economic Hope Confidence Skepticism Euphoria Cycles Concern Emotions Caution Now Despair Time Copyright by Richard Brock and Associates, Inc.

26 MAD MAD
27 $ Billion Net Farm Income -27% in 2014, -37% in 2015; Projected to Decline Additional 3% in Total Gross Income Total Expenses Net Cash Income Net Farm Income F F Source: USDA ERS, February
28 Corn Prices and Nitrogen Prices are Highly Correlated 400 USDA Nitrogen Price Index (1982=100) $8.00 Nitrogen Price Index (1982 = 100) Corn Price (Marketing Year) Nitrogen Fertilizer Price Index Corn Price $7.00 $6.00 $5.00 $4.00 $3.00 $2.00 $1.00 Average Corn Price (marketing year) 0 $0.00 Source: USDA NASS
29 $10,000 $8,000 Cropland Value per Acre California Iowa Illinois 10, % 8, % 7, % $6,000 Nebraska 5, % $4,000 United States 4, % Idaho 3, % $2,000 $ Source: USDA Land Values, August 2015 Summary
30 30 Farm Sector Debt Ratios Increasing Percent Debt-to-equity increasing: from: 12.8% in % in % in % in Debt/Equity 10 Debt-to-assets increasing: from: 11.3% in % in % in % in Debt/Assets F F Source: USDA ERS, U.S. Farm Income and Wealth Statistics, February
31 4,500 4,000 3,500 3,000 2,500 2,000 1,500 1, U.S. Gross Farm Income Correlation to Cropland Value Based upon USDA projected gross farm income as of February, land values should be closer to $3,298 vs. $4,130 per USDA survey in August. Cropland is 25% "overvalued" by historical valuation measures. Actual Land Value Land value per regression formula 200% 190% 180% 170% 160% 150% 140% 130% $3, % 110% 100% 90% 80% 70% 60% 50% % overvalued 40% 30% 20% 10% 0% -10% -20% % undervalued -30% -40% $4,130 in 2015
32 USDA Changes in Planted Acres (in millions) * compared with 2015 All Wheat Winter Wheat Other Spring sorghum Barley Soybeans Oats Dry Edible Beans Canola Sugar Beets Durum Wheat Rice Cotton corn * Prospective Plantings

33 Corn Supply & Demand
34 U.S. CORN SUPPLY AND DEMAND USDA Outlook Forum Brock Marketing year begins Sept 1 14/15 15/16 Proj 16/17 15/16 16/17 ACREAGE (million) 93.6* Planted Area Harvested Area Yield SUPPLY (mil bu) Beg. Stocks 1,232 1,731 1,837 1,731 1,837 Production 14,216 13,601 13,825 13,601 14,145 Imports Total Supply 15,479 15,382 15,702 15,382 16,012 USAGE (mil bu) Feed & Residual 5,324 5,250 5,425 5,300 5,400 Food/Seed/Ind 6,560 6,621 6,600 6,595 6,600 Ethanol & By-Products 5,200 5,250 5,225 5,225 5,225 Domestic Use 11,883 11,871 12,025 11,895 12,000 Exports 1,864 1,650 1,700 1,650 1,800 Total Use 13,748 13,521 13,725 13,545 13,800 Ending Stocks (mil bu, Aug 31) 1,731 1,862 1,977 1,837 2,212 CCC Privately-Owned 1,731 1,862 1,977 1,837 2,212 Stocks/Use 12.6% 13.8% 14.4% 13.6% 16.0% Farm Price ($/bu) $3.70 $ $3.60 $ $ * Prospective Plantings report
35 USDA Corn Acreage Top 10 States (million acres) State March 1 intentions Change from 2015 Iowa Illinois Nebraska Minnesota Indiana South Dakota Kansas Wisconsin Ohio Missouri Top 10 Total United States
36 110 Percent As of April 24th: 30% planted vs. 16% last year 16% 5-year average shaded area is 5-year range U.S. Corn Planting Progress 5-yr average Apr 03 Apr 10 Apr 17 Apr 24 May 01 May 08 May 15 May 22 May 29 Jun 05 Jun 12 Jun 19 Source: USDA NASS 2015 % Planted 5 year average +/ Missouri Minnesota Iowa Kentucky Tennessee Illinois Kansas Wisconsin Nebraska Michigan Ohio Indiana U.S
37 Average Farm Price ($ / Bushel) U.S. Corn Free Stocks/Use Ratio vs. Average Price (1975/76 - /17) Source: USDA, Brock Associates 2015/ % stocks/use; $ /bu / % stocks/use; $ /bu 0% 5% 10% 15% 20% 25% 30% 35% 40% 45% 50% 55% Corn Ending Free Stocks to Use Ratio (10 = 2010/11 marketing year) 85
38 U.S. Corn Production (million bu) * change from 2015 Iowa 1,877 2,140 2,367 2,505 2, % Illinois 1,286 2,100 2,350 2,013 2, % Nebraska 1,292 1,614 1,602 1,693 1, % Minnesota 1,374 1,294 1,178 1,429 1, % Indiana 597 1,032 1, % South Dakota % Missouri % Ohio % Kansas % Wisconsin % Michigan % North Dakota % Rest of States 1,600 2,076 1,886 1,668 1, % US TOTAL 10,755 13,829 14,216 13,601 13, % * assumes Prospective Plantings acreage, 20 year trend yield by state, and 20 year average percent harvested by state
39 2,000 million bu 1,750 1,500 1,250 1, Source: USDA Corn Export Commitments 0 Sep Oct Nov Dec Jan Feb Mar Apr May Jun Jul Aug 12% below last year 2015/ / /15 5 year average USDA Target 1,850 1,750 1,700 1,650
40 World Corn Export Share, 2007/08 to 2015/16 70% 60% 50% 40% 2012 Drought World Corn Export Volume: 2013/14: /15: est. 2015/16: % 20% 10% 0% U.S. Argentina Brazil Ukraine R.O.W. Source: USDA, April 2007/ /16
41 250 60% mil. metric tons Ending stocks/use 200 World Corn Ending Stocks and Stocks/Use +1.9 mmt from last month; +1.3 vs. last year 50% % % 50 20% - 75/76 80/81 85/86 90/91 95/96 00/01 05/06 10/11 10% Ending Stocks (left scale) Ending Stocks/Use (right scale) Source: USDA FAS, April
42 Million 20 metric tons 15 China Corn Imports & Exports Imports Exports Exports Source: USDA, April Imports 2.5
43 250 Million metric tons Production Consumption Ending Stocks Imports China Corn Fundamentals Record production Record consumption 100 Ending Stocks 50% stocks/use ratio 50 - Imports Source: USDA, April,
44 Ethanol
45 EPA Releases Final Renewable Fuel Obligations (RVO s) for RFS Statutory Mandate: Billion gallons Actual fuel ethanol production EPA Final RVO: June 2015 EPA Proposal Sources: RFA, EPA RFS Statutory Mandate Final Renewable Volume Obligations
46 $/gallon 4.00 Ethanol Costs, Revenues, and Profitability/Gallon Costs Profitability Revenues +$0.01 (0.50) Source: Iowa State University through March Brock est. for April
47 Million gallons U.S. Ethanol Imports and Exports Exports Imports Net exports Source: USDA FAS (through February; March data to be released in May)
48 $10.00 $/bu $9.00 $8.00 Central Illinois Cash Corn (1905 *) Years +29% 26 Years +40% 22 Years +32% 16 yrs +63% 2008 $8.54 $7.00 $6.00 $5.00 $4.00 $3.97 $5.25 $3.00 $2.00 $2.21 $2.84 $1.00 $ Years 14 Years 13 Years 9 Years * Updated April 26,

49 December Corn

50 Soybean Supply & Demand
51 U.S. SOYBEAN SUPPLY AND DEMAND USDA Outlook Forum Brock Marketing year begins Sep 1 14/15 15/16 Proj. 16/17 15/16 16/ * ACREAGE (million) Planted Acres Harvested Acres Yield SUPPLY ( mil bu) Beg. Stocks Production 3,927 3,929 3,810 3,930 3,928 Imports Total Supply 4,052 4,150 4,289 4,150 4,397 USAGE (mil bu) Crush 1,873 1,870 1,900 1,870 1,900 Exports 1,843 1,705 1,825 1,710 1,850 Seed Residual Total Use 3,862 3,705 3,850 3,711 3,895 Ending Stocks (mil bu, Aug 31) CCC Privately-Owned Stocks/Use 4.9% 12.0% 11.4% 11.8% 12.9% Farm Price ($/Bu) $10.10 $ $8.50 $ $ * Prospective Plantings report
52 USDA Soybean Acreage Top 12 States (million acres) State March 1 intentions Change from 2015 Iowa Illinois Minnesota Missouri Indiana Nebraska Ohio South Dakota North Dakota Kansas Arkansas Mississippi Top 12 Total United States
53 110 Percent As of April 24th: 3% planted vs. 2% last year 2% 5-year average shaded area is 5-year range U.S. Soybean Planting Progress yr average Apr 24 May 01 May 08 May 15 May 22 May 29 Jun 05 Jun 12 Jun 19 Jun 26 Jul 03 Source: USDA NASS
54 USDA World Soybean Production (million metric tons) 2012/ / / / /16 Change from Feb Brazil United States Argentina World Total Source: USDA, April World Soybean Production
55
56 Price Soybean Commitments of Traders Futures and Options Combined, as of April 19, Large Specs Price (dotted line, left scale) Contracts 200, , ,000 50, , , , ,000 Source:CFTC Commercials 8.00 Jun Jul Aug Sep Oct Nov Dec Jan Feb Mar Apr May Jun Jul -250, ,000
57 Continuous Monthly Soybean Futures 4 yrs 4 yrs 7/08 9/ $/bu Approximate time from peak to peak 5 yrs 5 yrs 4 yrs 2.5 yrs 4 yrs 6/88 5/04-53% /83-51% -53% 7/93 5/97-56% -53% Broken Support / /86 6/91 7/99 2/05 3 yrs 3 yrs 2 yrs Approximate time from peak to trough

58 November Soybeans

59 July Soybean Meal
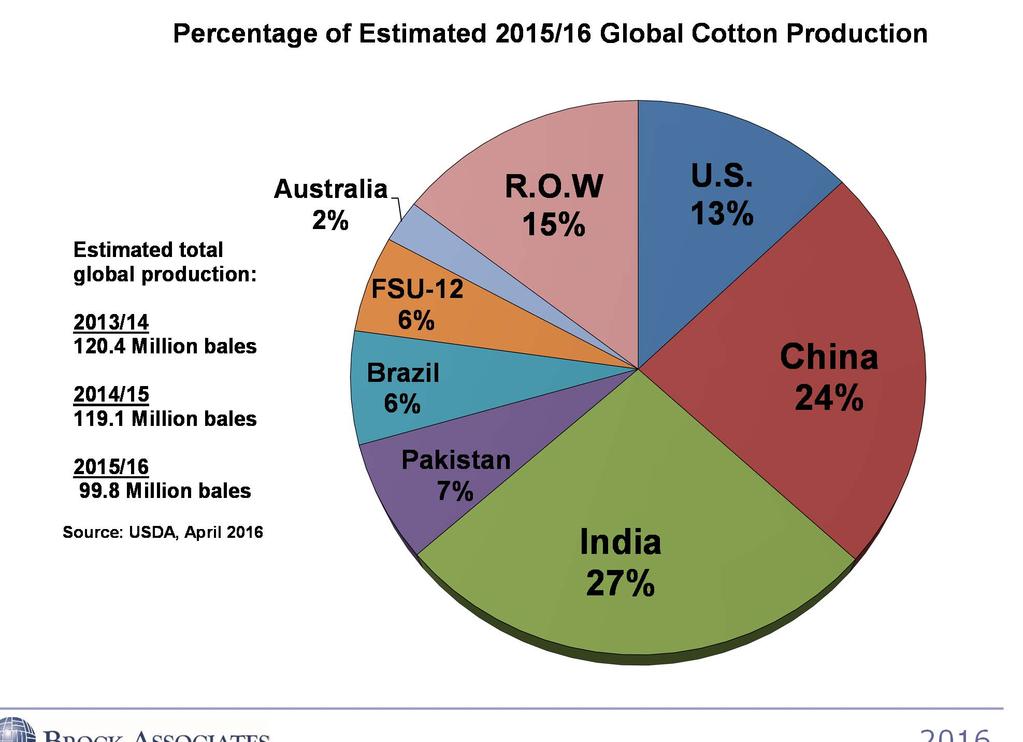
60 Cotton
61 U.S. COTTON SUPPLY AND DEMAND USDA Outlook Forum Brock Marketing year begins Aug 1 14/15 15/16 Proj 16/17 15/16 16/17 ACREAGE (million acres) Planted Area * Harvested Area Yield SUPPLY (million 480-lb. bales) Beginning Stocks (August 1) Production Imports Total Supply USAGE (million 480-lb. bales) Mill Use Exports Total Use Unaccounted STOCKS (million 480-lb. bales) Ending Stocks (July 31) Farm Price ( /lb) * Prospective Plantings report
62 18 U.S. Cotton Planted Area Million Acres
63 Percent As of April 24 th: 10% planted vs. 9% last year 13% 5-year average shaded area is 5 year range U.S. U.S. Cotton Planting Progress yr average 2015 Source: USDA
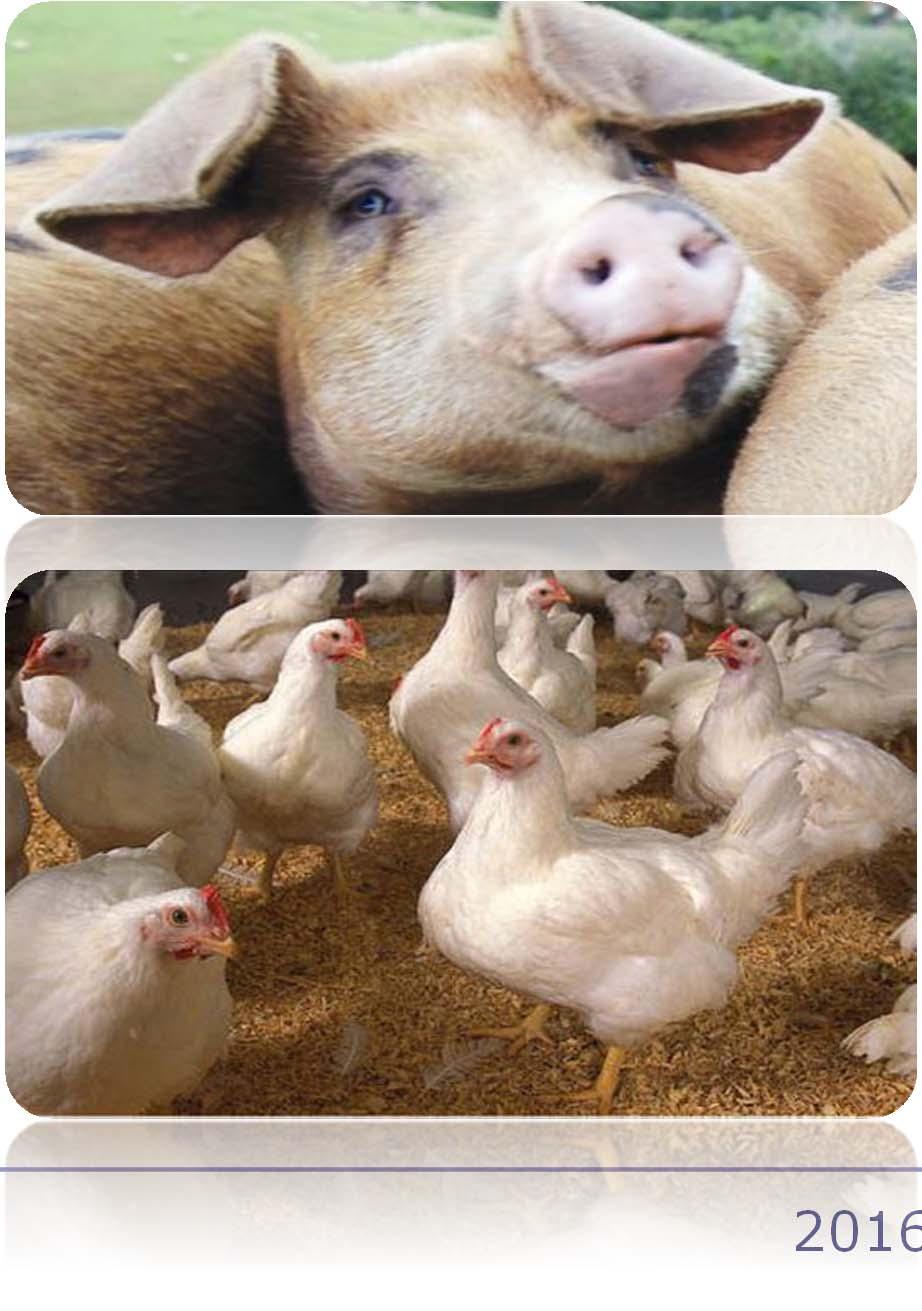
64 All Cotton Export Commitments (million bales) Aug Sep Oct Nov Dec Jan Feb Mar Apr May Jun Jul Source: USDA 5-yr average Last Year 2015/16 Commitments are: 25% below last year 33% below 5-year average USDA target:
65 World Cotton Ending Stocks and Stocks to Use World Cotton Stocks (Million 480-Pound Bales) Ending Stocks Ending Stocks to Use Ratio -1.1 from last month; -9.7 from 2014/15 120% 100% 80% 60% 40% 20% World Ending Stocks to Use Ratio 0 0% Source: USDA FAS, April
66 Cotton's Share of Fiber Consumption, U.S. 44% 42% 40% 38% 36% 34% 32% Source: USDA ERS, Cotton and Wool Yearbook, November
67
68 120 World Cotton Ending Stocks 100 U.S. World Cotton Stocks (Million 480-Pound Bales) R.O.W. China 63% of total 0 Source: USDA FAS, April

69 Cotton, Monthly Continuous

70 December Cotton Futures

71 Livestock Update
72 Billion lbs U.S. Meat Production and Forecast (and percent change 2015 vs. 2014, vs. 2015) +3.1% +3.1% Poultry All red meat and poultry combined: +2.6%, +3.2% USDA Outlook Forum: "red meat and poultry production will be record large in " Pork +7.2% +1.9% +4.8% -2.3% Beef proj. Source: USDA ERS, April
73 lbs. per capita U.S. Per Capita Meat Consumption (and annual percent change 2015 vs. 2014, vs. 2015) Poultry +5.7% +2.4% All red meat and poultry combined: +4.4%, +2.1% Beef -0.4% +2.0% Pork +7.3% +0.8% proj. Source: USDA ERS, April
74 $/head 2,200 2,000 1,800 1,600 1,400 1,200 1,000 1,250 lb. Live Cattle Value less 50 bu Corn Cost 10.6 years peak to peak 11.0 years peak to peak Apr '

75 Continuous Monthly Live Cattle Futures
76 Dairy
77 24,000 lbs/cow 22,000 U.S. Milk Production > U.S. per cow production estimated at 22,755 lbs; up 1.6% > production estimated at bil lbs; up 1.5% 240 billion lbs ,000 18,000 16,000 Production per cow (left scale) U.S. Production (right scale) , , , Source: USDA NASS, April, 100
78 National Milk Total Cost-of-Production $/cwt Source: USDA ERS
79 National Milk/Feed Price Ratio Pounds of 16-percent-protein mixed dairy feed equal in value to 1 pound of whole milk. Higher Feed-Pice Ratios Favor Higher Profitability Source: USDA 1.50
80 For More Information on the Brock Report, write, or call BROCK ASSOCIATES 2050 W. Good Hope Rd. Milwaukee, WI (800)
81 Disclaimer There is a risk of losses as well as profits when trading futures and options. This market analysis is not a solicitation or recommendation to buy or sell any futures contract or other security.