LEARNING FROM AGRICULTURAL TRIALS. Subtitle
|
|
|
- Michael Blake
- 5 years ago
- Views:
Transcription

1 LEARNING FROM AGRICULTURAL TRIALS Subtitle
2 Two Papers based on the Same Experiment Bridging the Yield Gap: from Agronomical to Economic Calculations of Returns Rachid Laajaj (U de Los Andes) Karen Macours (PSE & INRA) Cargele Masso (IITA) Moses Thuita (IITA) Bernard Vanlauwe (IITA) Learning-by-doing and learning-from-others: evidence from agronomical trials in Kenya Rachid Laajaj (U de Los Andes) Karen Macours (PSE & INRA)
 Karen Macours (PSE & INRA) Cargele Masso (IITA) Moses Thuita (IITA) Bernard Vanlauwe")
3 BRIDGING THE YIELD GAP: FROM AGRONOMICAL TO ECONOMIC CALCULATIONS OF RETURNS Rachid Laajaj (U de Los Andes) Karen Macours (PSE & INRA) Cargele Masso (IITA) Moses Thuita (IITA) Bernard Vanlauwe (IITA)
4 Motivation: the technology adoption puzzle Large literature in Development Economics: why farmers are not adopting technologies that appear to be profitable? - Credit constraint - Lack of information (how to use it or its return) - Supply side - Risk (and lack of insurance) Starts from the idea that technologies are suitable. Key evidence from agronomic trials. Yet done in very different conditions. May be profitable for some farmers but not others (Barrett) Implications on how to conduct trials & which technologies to promote
5 The Research Question Do the yields (yield increment) obtained in Agronomic Research Trials (Farmer Managed Trials) reflect the yield obtained by typical farmers using the same inputs in typical plots? What causes of the discrepancies between the two? Try to understand the reasons, from methodological challenges to different purpose, and propose solutions.
6 The Agronomic Research and Experiment Collected data on 960 farmers in 96 villages in 5 districts of Siaya (Western Kenya) In each village, 5 farmers were selected by the community to participate to the research trials and 5 were selected randomly Of the 10 farmers, 4 maize, 3 soya & 3 intercrop trials. Inputs applied for 3 consecutive seasons 24 villages started in LR14, 24 villages in SR14, and 48 control villages.
7 Design of the Maize Trial 1 m 5.0m 16.5m Local Seed C DH04 T3 Loc Seed + Phymix + Mavuno T2 DH04 + Phymix + Mavuno T4 4.5m 1 m Yield increment of fertilizer: (T2+T4+T6)/ (T1+T3+T5) IR T5 IR + Phymix + Mavuno T6 12.0
8 Design of the Soya Trial 1 m 5.0m Control C Biofix T2 4.5m 16.5m Minjingu T3 Sympal T5 Biofix + Minjingu T4 Biofix + Sympal T6 1 m Yield increment: (T4+T6)/2 - C 12.0
9 Main agronomical findings Maize No consistent significant differences between local seeds and different hybrids Large yield gains from Mavuno+Phymix Soya Both biofertilizer and P-source have significant impact (even more together) One of the P-sources (sympal) consistently outperforms the other Large regional heterogeneity & Yield gains increase over time
10 The Data Collection Standard agronomic data (for IITA research, part of Compro II) Rich observations during trials, from contact person and agronomist, including land preparation, knowledge assessment, motivation, etc. Soil properties from testing 6 Rounds of survey on the 960 households from baseline (Feb/March 14) to 2 seasons after end of trials (Aug/Sept 16) Intensive skills measurement instruments applied
11 Selection into trials, experimental effects, and empirical relationship with yield Selection Effort Selection (~ community selection) Trial Specific Effect on Effect On Trial Behavior Trial Yield Yield increment Increase + + Practices (related to better knowledge) Plot characteristics Soil properties Selected Selected within farmer Less selection across farmers Increase (better than on other plots) + No evidence (but little variation in practices on trials) - No evidence Residual effect of interventions (over time) + No evidence(?) no TBD TBD Other farmer characteristics Wealthier, higher education, etc Attrition Selected + (+) Calculation Method 0 Yields + + (mechanical)
12 Which farmers tend to be selected? Table 2: Baseline differences between randomly and community selected farmers random farmer selected farmer difference Skills cognitive skills (standardized) non-cognitive skills (standardized) technical skills (standardized) literacy household head years of education household head Literacy main farmer years of education main farmer Demographics Household head is main farmer Female household head * age household head Main farmer is female Age main farmer * household size Assets no cattle ownership number of cattle owned log (land owned) number of plots ** House material index ** Number of rooms in house
13 Which farmers (2) Table 2: baseline differences between randomly and community selected farmers Agricultural practices random farmer selected farmer difference Household uses manure Household uses some fertilizer Household uses some fertilizer or manure ** Always uses fertilizer in last 10 years Always uses fertilizer/manure in last 10 years ** uses intercropping uses crop rotation uses hybrid seeds uses fallow uses soil conservation practices ** uses gapping or thinning hires laborers at least 1 plot with 3 weedings at least 1 plot with 1 weeding N=937 Robust standard errors. p<0.01, ** p<0.05, * p<0.1
14 Example: Effort selection, trial specificity and Effect Selection: community selected farmers put significantly more effort than random farmers. Trial specific behavior: much more effort in trial than in farmer s neighboring plot VARIABLES Avg Yield MAIZE Yield Increment Avg Yield SOYA Yield Increment Effort (175.2) (190.4) (156.4) (121.7) Observations R-squared Controls vlg FE vlg FE vlg FE vlg FE p-val
15 Different Calculations for Different Objectives Agronomist wants to assess the potential of the inputs tested, economist wants returns as perceived by farmer Example 1: Adjustment for plant population - Ag (often) adjusts so that we can study the response - Econ does not want to inflate yields, real life issues Example 2: What to do in cases with 0 yield, because eaten by animals, hailstone, flood? - Ag removes it because can t evaluate input potential - Econ keeps it as 0 because input was paid for Implication: can calculate 2 different indexes
16 Can we bridge the gap between Agronomists and Economists Confirm many reasons for which trial results can be different from farmers context Traditional focus on soil characteristics, but management may matter at least as much Calculation methods can also have large effects Need to estimate the cumulative effects Implications on protocol & calculations Briding the gap between can push economists to better rely on agronomic results for what technologies to diffuse (should ag evidence of returns be a condition?).
 Karen Macours (Paris School of Economics and")
17 LEARNING-BY-DOING AND LEARNING-FROM-OTHERS: EVIDENCE FROM AGRONOMICAL TRIALS IN KENYA Rachid Laajaj (Universidad de Los Andes) Karen Macours (Paris School of Economics and INRA)
18 Why do we care about farmer s learning? Puzzle of low use of technologies that appear to be profitable how much is due to the lack of information of farmers? Can be due to not knowing how to use some inputs, or not knowing the actual returns of each input Compro 2 inspired by Compro 1, which shows high variability in the quality of different inputs: too costly for farmers to try all the inputs in order to find the ones that work best in their farms. => What happens if we explicitly demonstrate variability in returns? 18
19 Learning more from agronomical trials Farmers need to solve complex optimization with a lot of asymmetric info and uncertainty Expose farmers for 3 seasons to trials designed to learn about (heterogeneity of) returns Consider dynamic impacts on Learning Change of practices Adjustments of inputs Consider learning-by-doing and learning-from others for different types of farmers
20 Questions Do farmers learn (from their own trials and the ones of others) regarding differential returns to inputs? Does learning translate into actual demand? Does it lead to an increase in the Willingness to Pay of the farmers for the best inputs? And a reduction of the WTP for less good inputs? Does it lead to a change in practices How does all this change over time (3 seasons and after) How does it vary by farmer? 20
21 Consequences of different learning by farmer
22 Farmers perceptions about the trials In piloting (in 6 villages out of 12) almost no farmer knew the name of inputs that were tested. Hence we emphasized communication with farmers in main study: Signs that show what inputs is used in each subplot Manuals with description of inputs and practices handed to farmers Contact persons and agronomists were told their role to inform participants Surveys asking farmers about their plots (raised their attentions) Discussion sessions and field days by the end of the 3 rd season Awareness of inputs used 40-70% farmers able to name the inputs being used in their plots after 2-3 seasons Learning more subtle differences between subplots: Farmers more and more aware about differences in inputs and yields between subplots (more able to name Sympal than Minjingu) 22
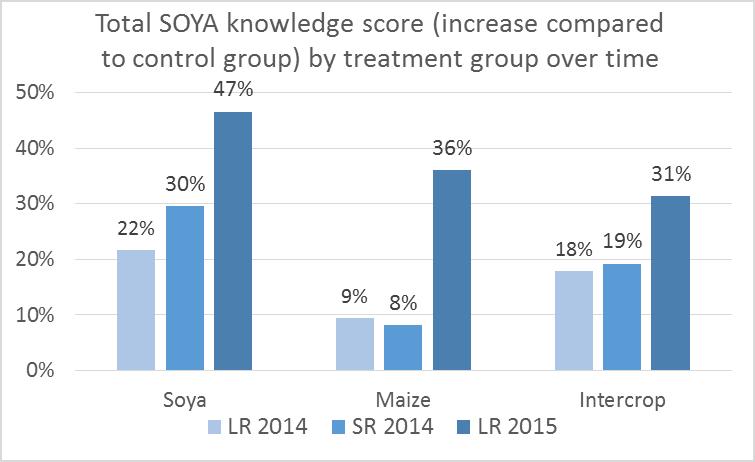
23 We test a set of questions to evaluate trial-related agricultural knowledge and track learning over time We look at multiple aspects of learning: Farming Knowledge (recommended spacing, where when and how to apply fertilizer, how store biofertilizer ). Some questions specific to soya and others to maize. willingness to pay : simulations of what they would want to buy Subjective expectations: estimation of the returns according to the farmer s beliefs of yield under different conditions 23
24 * ** 24
25 * * 25
26 ** ** 26
27 ** * 27
28 * 28
29 Additional Findings Significantly increased: talking about agriculture, farming practices, fertilizer and pass by each other s farm (or notice it) Community selected farmers (and higher skill farmers) learn significantly faster Agricultural practice index (gaping, spacing, nb of weeding ) increases for maize only. Increase in use of some inputs (Mavuno fert) and hybrid seeds tested, but limited by lack of availability of inputs. Soya and intercrop treatments > +5% points in cultivation of soya (+ than doubling, but starting very small) Lack of output markets. Subjective expectations about returns increased for best inputs package but only for community selected and by season 3.
30 What did we learn about learning? Many learned practices also applied in their own plots Learning match well the agronomic findings Increased the willingness to purchase the inputs, but low availability > limited effects on actual purchases Intra-household spillovers in learning within households Important to involve farmers in research trials Given difficulty to learn in ideal setting, how much more difficult is learning when so much changes every season! Learning depends on complexity of message and skills of the farmer (practices versus returns, relative quality between inputs ), which can interact with network. 31

31 Asante Sana!