Control of Sericea Lespedeza using Late-Season Prescribed Burning
|
|
|
- Kerry Harper
- 5 years ago
- Views:
Transcription

1 Control of Sericea Lespedeza using Late-Season Prescribed Burning KC Olson, W. H. Fick, J. A. Alexander, J. Lemmon, G. A. Gatson Department of Animal Sciences & Industry, Kansas State University Department of Agronomy, Kansas State University 1

2 Economic Impact of Prescribed Fire Estimated net income from improved cattle growth in the Flint Hills $2 to 5 million annually Inexpensive control of woody-stemmed plants Estimated cash cost of prescribed burning $.75 / acre Estimated cash cost of herbicide application $3 to 83 / acre Estimated cost of mechanical brush control $85 to 3 / acre Preservation of the native prairie Priceless! 2
3 Liabilities Associated with Prescribed Fire Use confined to a dogmatically narrow period of time in early spring Late March and April Smoke Management Downwind municipalities deal with degraded air quality when burning activities are concentrated in early spring Labor Management Early spring is also the busiest and most stressful time of year for Kansas farmers and ranchers Fire Safety Prescribed fires can be difficult to control and appropriate weather is relatively rare during early spring Early-spring fires do not control the most pernicious invasive species Sericea lespedeza and old-world bluestems Sericea Lespedeza: A Landscape Killer Tolerant of poor soils Robust canopy Resistant to grazing High in condensed tannins Deeply-rooted perennial Prolific seed production Extended seed dormancy September 2, 216 3
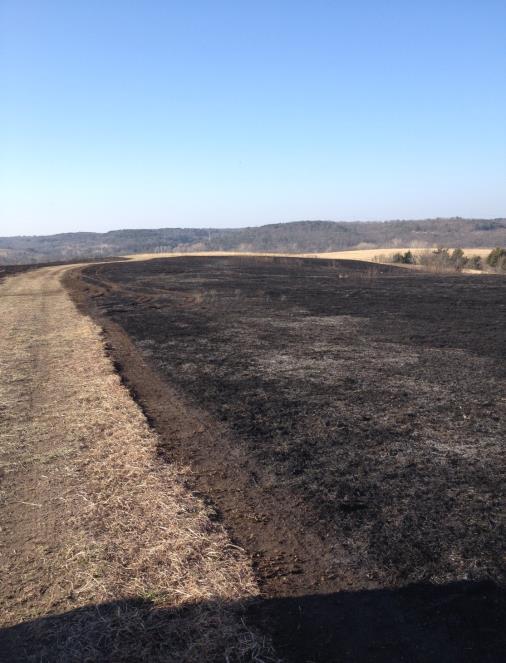
 The 125-ac site was divided into nine burn units (14 ± 6.")
4 Effects of Growing-Season Prescribed Burning on Vigor of Sericea Lespedeza Growing-Season Burns for Sericea Lespedeza Control This presentation reports results from a 4-yr experiment on native tallgrass prairie that is affected by sericea lespedeza National Fish & Wildlife Foundation (project no ) The 125-ac site was divided into nine burn units (14 ± 6.4 ac) that were burned annually for 4 consecutive years Prescribed fire treatments were: Early spring (1 April ± 11 d) Mid-summer (1 August ± 2 d) Late summer (1 September ± 3 d) 4

5 Precipitation, in 8/29/ Figure 1. Water-Year Rainfall: Fall 213 to Fall 217 Year 1 Year 2 Year 3 Year 4 Normal Pasture # 1 Burned Pictured on


6 Pasture # 1 Burned Pictured on Google Earth Imagery

7 Pasture # 5 Burned Pictured on Pasture # 5 Burned Pictured on

8 August 2, 216 September 4, 216 8

9 SL, % basal cover 8/29/218 Pasture # 7 Burned Pictured on Pasture # 3 Burned Pictured on Figure 2. Sericea lespedeza, % basal plant over a b Early spring Mid-summer Late summer P <.1 SEM = b 2 Basal cover, % a, b Means w/ unlike superscripts differ (P.1) 9
10 Aerial frequency, % of 3-cm 2 plots SL, % basal cover 8/29/218 Figure 3. Sericea lespedeza over time, % basal plant cover 14 Early spring 12 Mid-summer Late summer Year 1 Year 2 Year 3 Year 4 Treatment P =.2 Year P =.47 Treatment x time P =.35 Figure 4. Effect of growing-season fire on SL aerial frequency Early spring Mid-summer Late summer a Treatment - P <.1 Time - P =.36 Treatment x time - P =.28 SEM = b 2 c Treatment Main Effect a, b, c Means w/ unlike superscripts differ (P.2) 1
11 Whole-plant DM weight, mg/plant Mean SL stem height, cm 8/29/218 Figure 5. Effect of growing-season fire on SL stem height 5 Early spring Treatment x time P <.1 Mid-summer SEM = Late summer a a 3 b 2 bc 1 cd d Mid-July Mid-October a, b Means w/ unlike superscripts differ (P.4) Figure 6. Sericea lespedeza whole-plant weight at dormancy 5, a SEM = , 3, 2, 1, b b Early spring Mid-summer Late Summer a, b Means w/ unlike superscripts differ (P <.1) 11

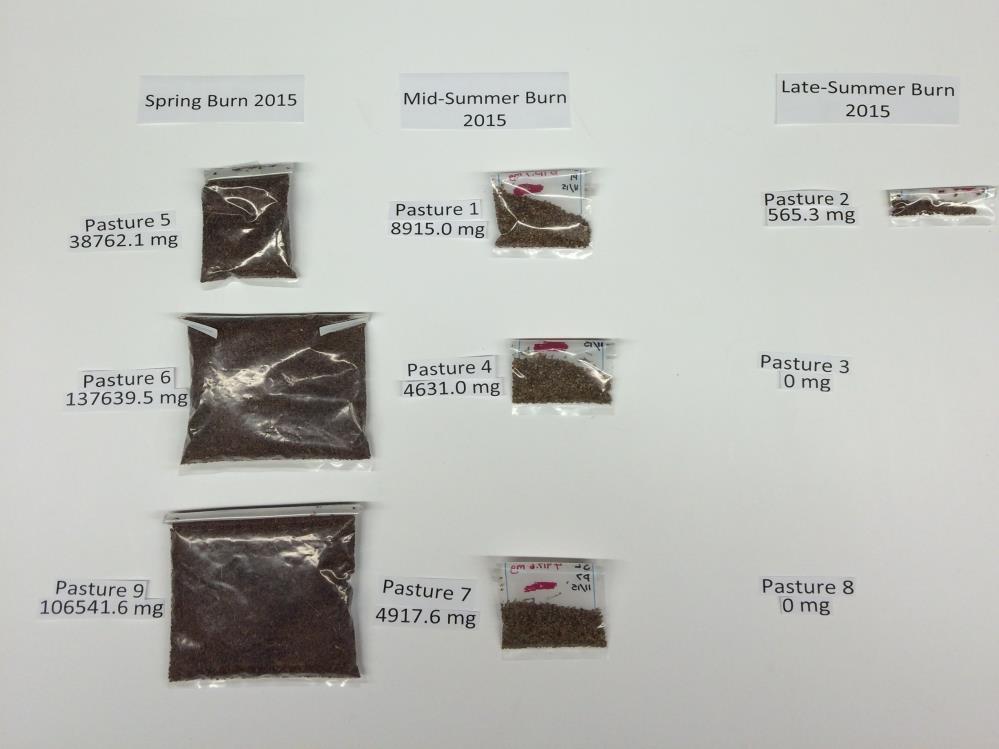
12 Seeds, no. / stem 8/29/218 1, 8 Figure 7. Sericea lespedeza seed production a SEM = b b Mid spring Mid-summer Late summer a, b Means w/ unlike superscripts differ (P <.1) 12

13 13

14 What happened to the sericea? Sericea plants were progressively weakened over time Understory and overstory plants were equally affected by growing-season fires Growing-season fires strongly suppressed seed production Regardless of when fire is applied, it scarifies sericea seeds and stimulates germination (Wong et al., 212) Seeds germinated in spring = juvenile plants with a full growing season to mature = maximum survival odds Seeds germinated in September or October = juvenile plants with little time to mature before winter = minimum survival odds 14

15 Bare soil, % area 8/29/218 Pasture # 2 Burned Pictured on So what happened to everything else? Figure 8. Bare soil, % of total area Early spring Mid-summer Late summer P =.88 SEM =
16 Litter cover, % area Plant cover, % area 8/29/ Figure 9. Litter cover, % of total area Early spring Mid-summer Late summer P =.93 SEM = Figure 1. Plant cover, % of total basal area Early spring Mid-summer Late summer P =.29 SEM =


17 Standing biomass, kg DM / ha 8/29/218 Figure 11. Effects of growing-season fire on forage biomass 7, 6, 5, 4, Treatment x time - P <.1 SEM = 42.5 a a a a Early spring Mid-summer Late summer 3, 2, 1, b b Mid-July Mid-October a, b Means w/ unlike superscripts differ (P <.1) Pasture # 8 Burned Pictured on Pasture # 8 Burned Pictured on

18 Standing biomass, kg DM / ha 8/29/218 Pasture # 8 Burned Pictured on Figure 12. Effects of growing-season fire on 217 SL biomass 7, 6, 5, 4, Max SEM = a a b c d c Early spring Mid-summer Late summer 3, 2, 1, e f f Total biomass Non-SL biomass SL biomass a, b, c, d, f Means w/ unlike superscripts differ (P <.1) 18
19 Table 1. Graminoid cover, % of total basal cover Item Early spring Mid-summer Late summer SEM * P-value Total grass cover, % C4 grasses, % C4 tall grasses, % 36.2 a 41.1 a 22.1 b 3.52 <.1 C4 mid grasses, % 28.2 a 23.7 a 39.3 b 3.48 <.1 C4 short grasses, % 3.3 a 1.1 b 3.4 a 1..4 C3 grasses and sedges, % Annual grasses, % * Mixed-model SEM associated with comparison of treatment main effect means. Treatment main effect. a, b Within row, means with unlike superscripts differ (P.5). Table 2. Specific graminoids, % of total basal cover Item Early spring Mid-summer Late summer SEM * P-value Big bluestem, % 18.4 a 18.1 a 11.9 b Indian grass, % 12.1 ab 15. a 9.4 b Switchgrass, % Little bluestem, % 14.2 a 11.8 a 23. b Sideoats grama, % * Mixed-model SEM associated with comparison of treatment main effect means. Treatment main effect. a, b Within row, means with unlike superscripts differ (P.5). 19
20 Table 3. Forb cover, % of total basal cover Item Early spring Mid-summer Late summer SEM * P-value Total forb cover, % Perennial forbs, % 15.3 a 1.9 b 9.7 b Sericea lespedeza, % 7.3 a 3.4 b 1.7 b 1.56 <.1 Baldwin s ironweed, %.7 a.2 b.4 b.16.1 Western ragweed, % 3.3 a.9 b.7 b.53 <.1 Major wildflowers, %.6 a.9 ab 1.4 b.28.3 Annual forbs, %.1 a 1.2 b 1.5 b.52.2 * Mixed-model SEM associated with comparison of treatment main effect means. Treatment main effect. a, b Within row, means with unlike superscripts differ (P.5). Table 3. Forb cover, % of total basal cover Item Early spring Mid-summer Late summer SEM * P-value Total forb cover, % Perennial forbs, % 15.3 a 1.9 b 9.7 b Sericea lespedeza, % 7.3 a 3.4 b 1.7 b 1.56 <.1 Baldwin s ironweed, %.7 a.2 b.4 b.16.1 Western ragweed, % 3.3 a.9 b.7 b.53 <.1 Major wildflowers, %.6 a.9 ab 1.4 b.28.3 Annual forbs, %.1 a 1.2 b 1.5 b.52.2 * Mixed-model SEM associated with comparison of treatment main effect means. Treatment main effect. a, b Within row, means with unlike superscripts differ (P.5). 2
21 Woody plants, % basal cover 8/29/218 Table 3. Forb cover, % of total basal cover Item Early spring Mid-summer Late summer SEM * P-value Total forb cover, % Perennial forbs, % 15.3 a 1.9 b 9.7 b Sericea lespedeza, % 7.3 a 3.4 b 1.7 b 1.56 <.1 Baldwin s ironweed, %.7 a.2 b.4 b.16.1 Western ragweed, % 3.3 a.9 b.7 b.53 <.1 Major wildflowers, %.6 a.9 ab 1.4 b.28.3 Annual forbs, %.1 a 1.2 b 1.5 b.52.2 * Mixed-model SEM associated with comparison of treatment main effect means. Treatment main effect. a, b Within row, means with unlike superscripts differ (P.5). 5 4 Figure 13. Shrub cover, % total basal cover Early spring Mid-summer Late summer P =.5 SEM = Basal cover, % 21
22 Combined cover, % basal cover 8/29/ Figure 14. Increaser shrubs*, % total basal cover Early spring Mid-summer Late summer P =.4 SEM = a b ab Basal cover, % * Combined basal cover of roughleaf dogwood, smooth sumac, and buckbrush. a, b Means w/ unlike superscripts differ (P =.4) Table 4. Species richness (no. of plant species identified) Item Early spring Mid-summer Late summer SEM * P-value Overall species richness 22 a 27 b 27 b 1.6 <.1 Native species richness 21 a 25 b 26 b 1.6 <.1 Graminoid richness Forb richness 1 a 15 b 15 b 1.2 <.1 a, b Within row, means with unlike superscripts differ (P.5). 22
23 Table 5. Forb species diversity Item Early spring Mid-summer Late summer SEM * P-value Forb richness 1 a 15 b 15 b 1.2 <.1 Forb species evenness.7 a.76 b.81 b.39.2 Simpson diversity index.57 a.73 b.83 b.66 <.1 Simpson dominance index.65 a.52 b.45 b.57 <.1 a, b Within row, means with unlike superscripts differ (P.5). Conclusions Forage biomass on all treatments averaged 4, lbs DM/acre over 4 years on July 17 Prescribed fire timing did not affect peak forage production Minor shifts between big bluestem and little bluestem basal cover occurred on the September treatment only Mid-summer & late-summer prescribed fires reduced basal & aerial frequency of SL Mid-summer & late summer prescribed fires decreased seed production by SL dramatically Improved forb heterogeneity in mid- and late summer treatments is a strong indication of improving rangeland health 23
24 Implications Growing season prescribed burning is consistent with responsible ecosystem stewardship in the Flint Hills Growing-season prescribed burning appears be an inexpensive and comprehensive means to control SL Current cash cost of prescribed burning is about $.75 / acre Current cash cost of fall-applied herbicide is $18 to $36 / acre Growing-season prescribed burning is temporally compatible with intensive early stocking Effects on animal performance are unknown but the cost of any performance decrease is unlikely to exceed the margin between burning and spraying costs Implications The cost of any performance decrease is unlikely to exceed the margin between burning and spraying costs Current value of gain - 65 to 85 lbs (Cattlefax) = $.9 / lb Historical IES stocking density = 3 ac / steer Cost to burn 3.3 acres = 3 ac x $.75 / ac = $2.25 Cost to spray 3 acres (including labor) = 3 ac x $18 / ac = $54. Spray / Burn margin for 3 ac = $54. - $2.25 = $51.75 Breakeven performance difference $51.75 $.9 / lb = 57.5 lbs less gain per steer ADG difference on burned vs. non-burned range is only.2 to.3 lbs/day.3 lbs/day x 1 days = 3 lbs extra gain 24
25 Implications Smoke Management Burning SL-affected acreage outside of the conventional fire season would decrease incidence of downwind air-quality problems Labor Management Burning some acreage outside of the normal window of time may result in improved time and labor management for ranchers Fire Safety Much of the energy of a growing-season fire is spent vaporizing water These fires burn with much less intensity, heat, and speed than conventional, dormant-season fires; loss of control is less likely Patience during ignition is required; some cleanup burning may be necessary for complete coverage August 2,
26 August 2, 216 August 2,

27 August 2, 216 August 4,