Sugar and Sweeteners Outlook
|
|
|
- Byron Rice
- 5 years ago
- Views:
Transcription
1 Economic Research Service Situation and Outlook Report SSS-M-363 November 15, 2018 Next release is December 17, 2018 Sugar and Sweeteners Outlook Michael McConnell, coordinator David Olson, contributor U.S. Sugar Deliveries for 2017/18 Lower than 2016/17 The U.S. sugar market in 2017/18 finished with ending stocks of million short tons, raw value (STRV) and a stocks-to-use ratio of 16.0 percent. Domestic deliveries for the completed fiscal year were reported 0.6 percent lower than the previous year at million STRV, including million STRV for food and beverage use. Projected domestic deliveries for 2018/19 are reduced to million STRV million STRV for food and beverage use representing a 1.1 percent annual increase from 2017/18 levels. Domestic sugar production for 2018/19 is projected to be million STRV, reduced primarily due to a lower forecast sugarbeet crop. Ending stocks for 2018/19 are projected to total million STRV, resulting in an 11.3-percent stocks-to-use ratio. Ending stocks in Mexico for 2017/18 were reported at million metric tons, actual value (MT). Deliveries for domestic users finished at million MT, including 482,000 MT of deliveries for the IMMEX program. Domestic deliveries for 2018/19 are projected to be million MT, accounting for less per capita sweetener consumption than previously forecast and higher deliveries for IMMEX. Ending stocks for 2018/19 are projected to be million MT, or a 36.6 percent stocks-toconsumption ratio. Approved by USDA s World Agricultural Outlook Board
2 U.S. Domestic Outlook Sugarbeet Crop Outlook Reduced, Leading to Lower Expected Beet Sugar Production, Partially Offset by Cane Increases The November World Agricultural Supply and Demand Estimates (WASDE) projects tighter sugar supplies in the United States for 2018/19, but also less use. The net result is a reduction in projected ending stocks compared with the October report. Total sugar supplies in 2018/19 are projected to be million short ton, raw value (STRV), a 268,000-STRV reduction from the previous month. Some of the reduction is due to a 21,000- STRV decrease in beginning stocks due to changes in the 2017/18 balance table. Most of the reduction is due to a net decrease of 247,000-STRV in domestic production. Table 1: U.S. sugar: supply and use, by fiscal year (Oct./Sept.), November 2018 Items 2017/ /17 (estimate) 2018/19 (forecast) 2016/ /18 (estimate) 2018/19 (forecast) 1,000 Short tons, raw value 1,000 Metric tons, raw value Beginning stocks 2,054 1,876 1,993 1,863 1,702 1,808 Total production 8,969 9,293 9,015 8,137 8,430 8,178 Beet sugar 5,103 5,279 4,974 4,629 4,789 4,513 Cane sugar 3,866 4,014 4,041 3,507 3,641 3,666 Florida 2,055 1,983 2,050 1,864 1,799 1,860 Louisiana 1,628 1,862 1,841 1,477 1,689 1,670 Texas Hawaii Total imports 3,244 3,277 2,801 2,943 2,973 2,541 Tariff-rate quota imports 1,611 1,663 1,564 1,462 1,509 1,419 Other program imports Non-program imports 1,213 1, ,101 1, Mexico 1,201 1, ,090 1, Total supply 14,267 14,446 13,809 12,943 13,105 12,527 Total exports Miscellaneous Deliveries for domestic use 12,258 12,186 12,320 11,121 11,055 11,177 Transfer to sugar-containing products for exports under re-export program Transfer to polyhydric alcohol, feed, other alcohol Commodity Credit Corporation (CCC) sale for ethanol, other Deliveries for domestic food and beverage use 12,102 12,048 12,175 10,979 10,930 11,045 Total use 12,391 12,453 12,405 11,241 11,297 11,254 Ending stocks 1,876 1,993 1,404 1,702 1,808 1,273 Private 1,876 1,993 1,404 1,702 1,808 1,273 Commodity Credit Corporation (CCC) Stocks-to-use ratio Source: U.S. Dept. of Agriculture, Economic Research Service, Sugar and Sweetener Outlook. 2
3 Domestic sugar production is projected to be million STRV. Beet sugar production is reduced 262,000 STRV from the October report, totaling million STRV. The reduction is due to 4.9-percent less sugarbeet production forecast by the National Agricultural Statistics Service (NASS) in the November Crop Production report. Estimates to 2017/18 beet sugar production are raised 34,000 STRV to million STRV, based on reported production numbers by processors for September 2018 to the Farm Service Agency s (FSA) Sweetener Market Data (SMD) which rounds out the full 2017/18 fiscal year. Table 2: Beet sugar production projection calculation, 2017/18 and 2018/ / / / / / / / / /19 October November October November Sugarbeet production (1,000 short tons) 1/ 35,224 32,789 31,285 35,371 36,881 35,325 35,325 35,215 33,504 Sugarbeet shrink 2/ 4.8% 6.8% 5.4% 6.5% 8.3% 7.3% 7.3% 6.9% 6.9% Sugarbeet sliced (1,000 short tons) 33,532 30,545 29,595 33,066 33,834 32,742 32,742 32,785 31,192 Sugar extraction rate from slice 15.3% 14.3% 14.6% 14.6% 13.7% 15.2% 15.2% 14.7% 14.7% Sugar from beets slice (1,000 STRV) 5,142 4,325 4,325 4,820 4,643 4,970 4,970 4,831 4,596 Sugar from molasses (1,000 STRV) 2/ Crop-year sugar production (1,000 STRV) 3/ 5,469 4,648 4,667 5,201 4,995 5,338 5,338 5,199 4,964 August-September sugar production (1,000 STRV) August-September sugar production forecast (1,000 STRV) Sugar from imported beets (1,000 STRV) 4/ Fiscal year sugar production (1,000 STRV) 5,076 4,794 4,893 5,119 5,103 5,245 5,279 5,236 4,974 Notes: 1/ National Agricultural Statistics Service, U.S. Dept. of Agriculture. 2/Projections based on processor forecasts published by U.S. Dept. of Agriculture, Farm Service Agency. 3/ August-July basis. 4/ Sugar from imported beets split out for projections only, included in total once full crop-year slice is recorded. They are incorporated into total production in historical data. Source: U.S. Dept. of Agriculture, Economic Research Service and World Agricultural Outlook Board. Early-season production for the 2018/19 sugarbeet crop came in at 655,000 STRV not as large as the previous year s record amount but still relatively large by historical standards. This result was anticipated based on the planting progress of the spring. Early season production for the 2019/20 sugarbeet crop is also raised, based on the updated average of the preceding 5 years. 3

4 The 2018/19 sugarbeet crop forecast was reduced significantly after cold weather detrimentally impacted the harvest. NASS reduced the national forecast from 32.8 tons per acre in the September Crop Production report down to 30.5 tons per acre in the August report, demonstrating the change in prospects over the past few months. On a tonnage basis, the largest sugarbeet production reductions from the previous month s report are from the Upper Midwest States of Minnesota and North Dakota, accounting for 1.3 million short tons less sugarbeet production or 74.1 percent of the national reduction primarily based on a forecast of significantly lower yields. This is likely due to unusually cold weather during October in the Red River Valley that straddles the Minnesota and North Dakota border. The conditions stalled harvest progress and may have implications for the quality of the sugarbeets that are beginning to be piled and stored for the winter slicing season, but current forecasts left recovery rates and shrink rates unchanged from previous expectations. Reported sugar production from beet processors during November and December will be instructive about the quality of the current sugarbeet crop being sliced, but it will be several months before that data is available. The reduction in sugarbeet production is substantial enough by itself, however, to reduce beet sugar production expectations. 4
5 5

6 Cane sugar production for 2018/19 is projected to total million STRV, a 15,000-STRV increase from the October number. The increase is due to higher expectations for Louisiana sugarcane production. NASS increased its sugarcane yield forecast from 31.3 tons per acre in the October report to 33.0 tons per acre. This is partially offset by lower expected recovery rates, as reported by processors. Production in Florida and Texas remains unchanged from the previous month at million STRV and 150,000 STRV, respectively, after only minor crop adjustments made by both NASS and processors. Cane sugar production for 2017/18 is estimated at million STRV, a 10,000-STRV increase from the previous month. The change is also due to increased production in Louisiana, based on reported production of the early-season harvest of the 2018/19 crop that is accounted for prior to the October 1 start of the fiscal year. Florida and Texas production remains unchanged from the previous month. 6
7 Imports in 2017/18 Reduced, 2018/19 Unchanged Estimated imports for 2017/18 are million STRV, with preliminary final reporting by multiple data sources for the full fiscal year now available. The estimate is a 38,000-STRV reduction from the previous month s estimate. Imports from quota programs are decreased a slightly to million STRV. Imports from Mexico are reduced 46,000 STRV, totaling million STRV. The reduction is based on reporting through September 2018 from the U.S. Census Bureau. It suggests that Mexico did not completely utilize all of its allocated licenses under the 2017/18 Export Limit, as defined under the Suspension Agreements although only by a relatively small percentage of the total. Conversely, high-tier imports are increased by 9,000 STRV to 64,000 STRV, partially offsetting the decline in imports from Mexico. Shipments of these imports, which pay a higher duty rate, continued to come in at a higher rate by historical standards through the end of 2017/18, and indications are that the early months of 2018/19 will continue to see shipments at comparable levels. These flows can abruptly change, however, making it difficult to assess whether they will be sustained for the duration of 2018/19. The price differential between the U.S. wholesale market and the world refined sugar futures market in the past few months likely allowed traders and commercial users to complete transactions at profitable levels for the high-duty imports to enter the United States in subsequent months. Price differentials have lessened recently, particularly as World refined futures contract prices have increased from the recent nadir levels of July
8 Imports in 2018/19 are projected to be million STRV, unchanged from the October projection. The total is predicated on expected trade under quota programs, the latest calculation of U.S. Needs by the Department of Commerce subsequent to the September WASDE for imports from Mexico, and high-tier tariff imports that are likely to be at relatively higher monthly levels through the first quarter of 2018/19. U.S. 2017/18 Deliveries Finish Below Prior Year Domestic deliveries for food and beverage use for the full 2017/18 fiscal year are reported at million STRV, based on the most recent release of the Farm Service Agency s (FSA) Sweetener Market Data (SMD). The full-year total represents a 52,000-STRV reduction from the previous month s forecast and a 0.4-percent decline from 2016/17 levels. 8
9 Beet processors finished the fiscal year delivering million STRV for food and beverage use. Although a 1.3-percent decline from the previous year, this represents the second consecutive year of deliveries above 5.0 million STRV a level not previously reached. Deliveries by cane refiners totaled million STRV, a 1.4-percent increase. This was still lower than deliveries in recent years, which reached million STRV in 2015/16 after 8 years of annual growth starting in 2008/09. Constrained supplies of raw sugar led to a significant decline in melt rates and deliveries by the sector in 2016/17. The increase in 2017/18 coincided with a buildup of raw sugar supplies and an improvement, although inconsistent, in melt rates and deliveries. Deliveries from nonreporters, representing refined sugar that is imported into the United States and not refined or marketed by beet processors or cane refiners covered under the U.S. sugar program, totaled 664,000 STRV in 2017/18 a 17.2-percent decline from the year before and continuing the downward trend for the past 5 years, when deliveries peaked just under 1.0 million STRV in 2013/14. The reduction is mostly attributed to fewer direct-consumption imports from Mexico due to the terms of the Suspension Agreements signed between the U.S. Department of Commerce (USDOC) and the Government of Mexico in December 2014 and 9

10 amended in June The terms of the agreements limit the amount of sugar that can be imported from Mexico and used for direct consumption or transported by means other than bulk ocean-going vessels; both of which are important competitive factors for direct-consumption imports. Deliveries for food and beverage use for 2018/19 are projected to be million STRV, a 75,000-STRV reduction from the previous month s forecast. The adjustment is primarily due to adjustments made to 2017/18 totals and represents a 1.1-percent annual increase. U.S. sugar use has trended upward in recent years, despite some instances of yearover-year declines. There is evidence that the rate of growth recently has slowed, however. Ending Stocks Finish Higher in 2017/18, With More Raw than Refined Sugar in Inventories Reported ending stocks for 2017/18 totaled million STRV, as reported by domestic processors and refiners, a 21,000-STRV reduction from the previous month s estimate. Compared with 2016/17 ending stocks, totals are 6.2 percent higher than those of the previous year. 10
11 Perhaps more significant than the total of overall ending stocks is their structure in 2017/18 compared with other years. Ending stocks of refined sugar are only 2.5 percent higher than the previous year. Beet processors inventories at the end of September finished nearly identical to the previous year. Cane refiners stocks of refined sugar heading into 2018/19 were higher than the previous year s extremely low levels, but still remained tight by historical standards after carrying low levels through most of the fiscal year. Conversely, raw sugar inventories were 12.8 percent higher than the previous year. Inventories from cane processors which are comprised of raw sugar from domestically produced sugarcane were 77,000 STRV compared with the previous year s level of 13,000 STRV. This was likely due to the record-large sugarcane crop and cane sugar production in Louisiana during 2017/18. While cane processors inventories typically build during the harvest season as sugar is produced, they generally carry very low supplies by the end of the fiscal year as sugar is marketed or transferred to cane refineries. The relatively large ending stocks for processors may indicate that the large supplies produced during 2017/18 resulted in more raw sugar being held further upstream particularly for processors in Louisiana and Texas that use refining 11
12 capacities in the Gulf. Cane refiners ending stocks of raw sugar finished 3.3 percent higher than the previous year; however, this was mitigated by inventories that increased substantially at the end of 2016/17, during the time when processors transfer supplies to refiners in order to satisfy loans made under the USDA s nonrecourse loan program. In 2017/18, refiners raw stocks were at substantially higher levels, partially due to increased imports. As a result, physical and economic constraints may have limited the ability of the market to move raw sugar supplies to refiners farther from processors locations who had more available storage capacities. 12

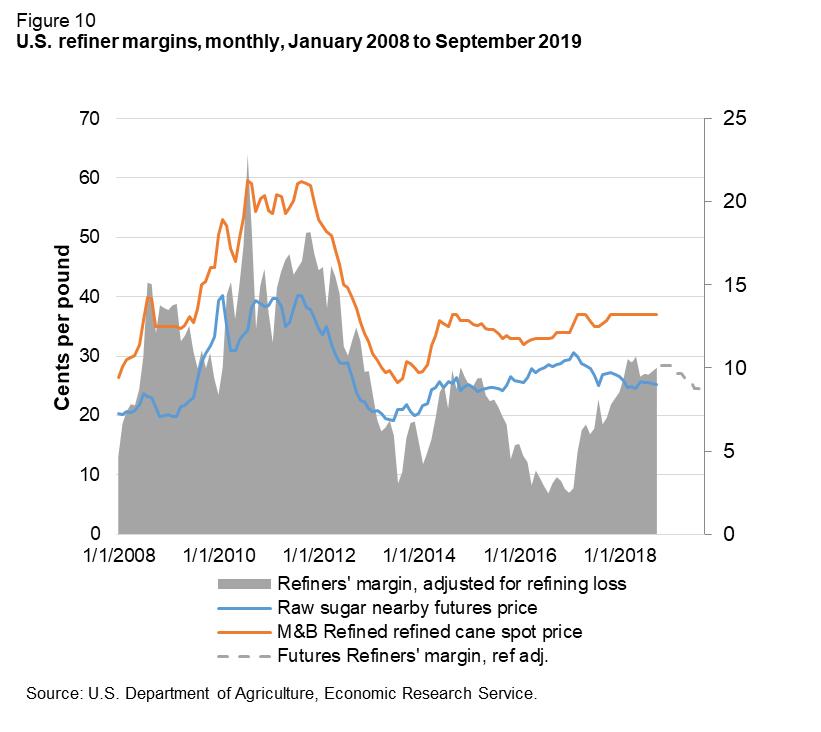
13 U.S. Wholesale Refined Prices Increase as Lower Expected Supplies Affect Market Midwest wholesale refined beet sugar spot prices in October averaged cents per pound lower than the previous fiscal year average of cents, but higher than reported offerings of 33.0 cents heading into the year. Similarly, reported spot prices for Northeast cane refined sugar increased from 35.0 cents per pound heading into the year to cents during October. The price increase coincided with the developments in the sugarbeet harvest, as the market anticipated tighter refined sugar supplies, particularly in the first half of the fiscal year. Along with lower U.S. raw sugar futures contract pricing, the outlook for cane refiners margins appears to be in line with the end of 2017/18, which would be an improvement from the levels during 2015/16 and 2016/17. 13
14 14
15 Mexico Outlook Mexico Domestic Deliveries for Human Consumption Lowered for both 2017/18 and 2018/19 Total use in Mexico for 2017/18 is estimated at million metric tons, actual value (MT), a 36,000-metric ton, actual value (MT) reduction from the October estimate. The changes are based on full-year reporting from Conadesuca for the completed fiscal year. Table 3: Mexico sugar supply and use, 2016/ /18 and projected 2018/19, November 2018 Items 2016/ /18 (estimate) 2018/19 (forecast) 1,000 metric tons, actual weight Beginning stocks 1,037 1,002 1,395 Production 5,957 6,010 6,025 Imports Imports for consumption Imports for sugar-containing product exports, IMMEX 1/, other Total supply 7,087 7,232 7,535 Disappearance Human consumption 4,515 4,228 4,413 For sugar-containing product exports (IMMEX) Other deliveries and end-of-year statistical adjustment Total 4,851 4,739 4,893 Exports 1,234 1,099 1,028 Exports to the United States & Puerto Rico 1,028 1, Exports to other countries Total use 6,085 5,838 5,921 Ending stocks 1,002 1,395 1,613 1,000 metric tons, raw value Beginning stocks 1,099 1,062 1,478 Production 6,315 6,370 6,387 Imports Imports for consumption Imports for sugar-containing product exports (IMMEX) Total supply 7,512 7,666 7,987 Disappearance Human consumption 4,786 4,482 4,678 For sugar-containing product exports (IMMEX) Other deliveries and end-of-year statistical adjustment Total 5,142 5,023 5,187 Exports 1,308 1,165 1,090 Exports to the United States & Puerto Rico 1,090 1, Exports to other countries Total use 6,450 6,188 6,276 Ending stocks 1,062 1,478 1,710 Stocks-to-human consumption (percent) Stocks-to-use (percent) High fructose corn syrup (HFCS) consumption (dry weight) 1,522 1,593 1,593 1/ IMMEX = Industria Manufacturera, Maquiladora y de Servicios de Exportación. Source: USDA, World Agricultural Supply and Demand Estimates and Economic Research Service, Sugar and Sweeteners Outlook; Conadesuca. Domestic deliveries in Mexico in 2017/18 are estimated at million metric tons, actual value (MT), a 12,000-MT increase from the previous estimate. Domestic deliveries for human 15
 for the year increased 4.5 percent, however, totaling 1.593 million MT, partially offsetting the lower volumes of sugar.")
16 consumption are reduced 108,000 MT from the October report, totaling million STRV. Compared with 2016/17, deliveries for human consumption were 6.4 percent lower in 2017/18. Deliveries for high-fructose corn syrup (HFCS) for the year increased 4.5 percent, however, totaling million MT, partially offsetting the lower volumes of sugar. Domestic deliveries to the IMMEX program are raised 92,000 MT to 482,000 MT. The increase is due to a substantially large volume of sugar delivered in September ,000 MT, nearly double the next-largest monthly total since 2008/09. Falling domestic prices and large volumes of exports expected to the world market prior to the end of the calendar year likely make the IMMEX program an attractive marketing avenue. 16
17 Domestic deliveries for 2018/19 are projected to be million MT. Deliveries for human consumption are projected to be million MT, a 148,000-MT decrease from the previous month. This would still represent a 4.4-percent increase from the 2017/18 estimate. The total is based on a per capita sweetener total in line with the 5-year average and HFCS deliveries projected to remain level with the 2017/18 estimate. Deliveries for the IMMEX program are projected to be 480,000 MT a 90,000-MT increase from the October projection as the drivers spurring IMMEX deliveries in 2017/18 are expected to remain significant in 2018/19. Exports for 2017/18 are estimated at million MT, including million MT shipped to the United States. Exports to the United States are based on reported entries from the U.S. Census Bureau. Exports to other destinations are estimated at 52,000 MT, a 9,000-MT reduction from the previous month s estimate, based on updated figures published by Conadesuca. Included in the 52,000 MT are 34,0000 MT shipped to the United States through the U.S. re-export program, as these shipments are not under the scope of the Suspension Agreements and do not require Export Licenses. Exports for 2018/19 are projected to total million MT, a 53,000-MT reduction from the previous month. The reduction is due to fewer exports to non-u.s. destinations, which are now reduced to 307,000 MT. This total includes supplies from 2017/18 that have been committed to the FIMEA program, which will market exports to the world market before the end of the 17
18 calendar year, according to Conadesuca. Exports to the United States are projected to total 721,000 MT, unchanged from the previous month s projection and based on the U.S. Department of Commerce s calculation of U.S. Needs from the September WASDE; as specified under the Suspension Agreements. The next calculation from the agency will be subsequent to the December WASDE. Forecast for Mexico Sugar Production in 2018/19 Unchanged, as Harvest Season Set To Begin in November The USDA projects Mexico sugar production in 2018/19 at million MT, unchanged from the previous month. The total is based on trends in yields and recovery rate from recent years and a small increase in harvested area from the 2017/18 campaign. In November, Conadesuca released its first forecast for sugar production in 2018/19. The organization forecasts million MT of sugar coming from 823,000 hectares of sugarcane harvested. Both totals would be substantial increases from the previous year and recent years harvest campaigns. This year s harvest season is just getting underway, with mills scheduled to begin operations between early November and early January, depending on location. The progress and reporting by mills during the harvest season will be an important factor in adjustments made to Mexico s production outlook in the coming weeks and months. Ending stocks in Mexico are projected at million MT, a 178,000-MT increase from the previous month. The increase is due to lower projected domestic deliveries, exports, and an increase of 67,000 MT in beginning stocks being carried over from 2017/18. The resulting percent stocks-to-consumption ratio would be large by historical standards. Suggested Citation McConnell, Michael J. and David Olson, Sugar and Sweeteners Outlook, SSS-M-363, U.S. Department of Agriculture, Economic Research Service, November 15,