Fungicides and Irrigation Water Management. Moose Jaw, Dec 6 & 7 ICDC/SIPA Conference Rory Cranston PAg. Provincial Irrigation Agrologist
|
|
|
- Phoebe Dalton
- 5 years ago
- Views:
Transcription


1 Fungicides and Irrigation Water Management Moose Jaw, Dec 6 & 7 ICDC/SIPA Conference Rory Cranston PAg. Provincial Irrigation Agrologist
2 Projects Dry Bean Irrigation Scheduling White Mold Disease Survey White Mold Control in Dry Beans Fungicide Application Timing on Wheat Canola Fungicide Demonstration Irrigation Water Management
3
4 Dry Bean Irrigation Scheduling Objective was to demonstrate two irrigation strategies for dry beans Two treatments and a dry land check Adequate Irrigation Deficit irrigation (no irrigation prior to flowering) Varieties WM2, Winchester, AC Island, Othello, Medicine Hat, Maya
5 Dry Bean Irrigation Scheduling Project was located at CSIDC Dr. Jazeem Wahab Greg Larson Adequate Irrigation First irrigation June 15 Nine irrigations for 112.5mm (4.5 inches) Deficit Irrigation (prior to flowering ) First irrigation July 27 Five Irrigations for 62.5mm (2.5 inches)
6 Dry Bean Irrigation Scheduling Results of this project are still being processed
7 White Mold Disease Survey Objective to determine the critical control period for white mold in dry beans in the LDDA Surveyed six fields every week from the start of July to the end of August Three in Riverhurst Dale Ewen, Gordon Kent, Rodney Kent Three in Luck Lake Garth Weitermen, Grant Carlson (two fields)
8 White Mold Disease Survey ((severity class x number of plants in class) x 100) / number of plants Severity classes 0 = No disease 1 =Small lesions less than 5cm in the longest dimension 2= Expanding lesions on branches or stem 3= Up to half of branches or stem colonized 4= More than half of the branches or stem colonized and/or plant dead
9 White Mold Disease Survey 100 plants were surveyed each week to determine disease severity Disease Severity Date Site 1 Site 2 Site 3 Site 4 Site 5 Site 6 19-Jul Jul Aug Aug Aug Aug Used the following equation to determine disease severity
10
11
12
13
14
15 White Mold Disease Survey White mold first showed up on July 19 Was present in all fields by August 2 A application of fungicide in the middle of July prevented early infection An application of fungicide after infection occurred stopped further development in two cases
16 White Mold Control in Dry Beans Objective was to demonstrate the best combination of fungicides in two fungicide application system One demonstration site Craig and Michael Millar, Birsay SK Three treatments Lance Allegro Allegro Lance Allegro - Allegro
17 White Mold Control in Dry Beans 2011 had a low incidence of white mold Disease severity on Aug 24 Lance Allegro 20 Allegro Lance 21 Allegro - Allegro 15 Yield on Sept 11 Lance Allegro 2154 lb./acre Allegro Lance 2211 lb./acre Allegro - Allegro 2995 lb./acre
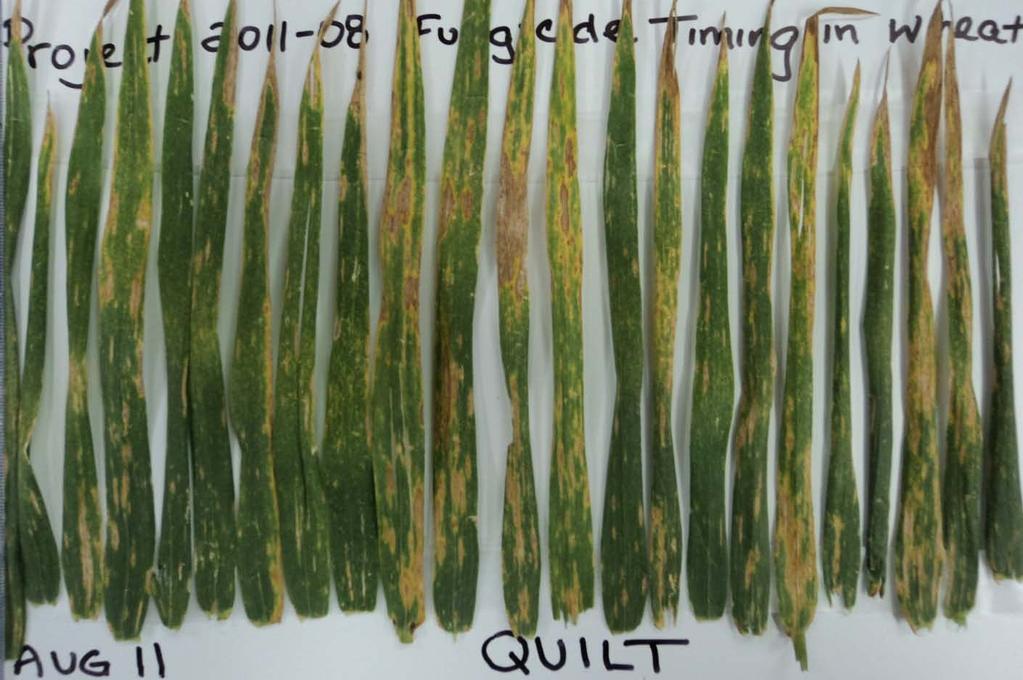
18 Fungicide Application Timing Objective was to demonstrate the best timing for a fungicide application on wheat One demonstration site Grant Pederson, Outlook SK Three treatments and untreated check Application at flag leaf Application at flowering Combination
19 Fungicide Application Timing Leaf samples taken on Aug 11 showed visual difference of disease presence

20

21
22

23
24 Fungicide Application Timing Harvest results on Sept 10 Treatment Flowering Flag Leaf Combination Untreated Yield (bu./acre) F.graminearium 4% 7.5% 4% 2.5% Total Fusarium 5% 10.5% 7% 3% TKW Grade
25 Canola Fungicide Demonstration The objective of this project was to compare a single fungicide application to two fungicide applications in canola One demonstration site Mark Gravalle, Riverhurst SK. Two treatments compared to an untreated area One application of fungicide Two applications of fungicide
26 Canola Fungicide Demonstration There was a noticeable difference between the treated and untreated areas

27 Canola Fungicide Demonstration There was a noticeable difference between the treated and untreated areas
28 Canola Fungicide Demonstration There was a noticeable difference between the treated and untreated areas The producer noted that the treated areas were much easier to harvest Disease Severity (equation next slide ) Two Applications 1.6 One Application 2.2 Check 4.3
29 Canola Fungicide Demonstration Sum of the rating of all infected plants = Disease severity The number of infected plants 0 - No symptoms 1 Infection of pods only 2- Lesions situated on main stem or branches with potential to affect up to ¼ of seed formation and filling on plant 3- Lesions situated on main stem or branches with potential to affect up to ½ of seed formation and filling on plant 4- Lesions situated on main stem or branches with potential to affect up to ¾ of seed formation and filling on plant 5- Main stem lesion with potential effects on seed formation and filling of entire plant
30 Canola Fungicide Demonstration Harvest results on Sept 12 Treatment Two App One App Check Yield bu./acre TKW 3.165g 3.193g 2.953g There was a sandy knoll in the single app treatment where the crop was visibly thinner. Favors the two app treatment
31 Irrigation Water Management The Objective of this project was to compare actual on farm water management practices to the optimum predicted by the Alberta Irrigation Management Model (AIMM) Six sites Three in the LLID and three in the RID Roy King, Randy Bergstrom, Craig Langer, Gary Ewen
32 Irrigation Water Management Local weather station in each irrigation district collected environmental data Actual crop water use was calculated using the water balance formula ET = (P + I) R D ± S Where ET = actual crop water use or evapotranspiration P = precipitation I = effective irrigation R = runoff D = deep percolation S = change in soil moisture
33 Irrigation Water Management Sites were visited weekly Optimum irrigation plan was developed in AIMM based on field, crop, and local weather Irrigation events were added in 25mm increments at least 3 days apart and were managed to keep soil moisture at an optimum level above 70%
34
35
36
37
38 Irrigation Water Management District Crop Crop Water use Act/opt Actual(mm) Optimum(mm) Riverhurst Durum % Canola % Flax % Luck Lake Durum % HSW % Flax % All sites average %
39 Irrigation Water Management District Crop Effective Irrigation Act/opt Actual(mm) Optimum(mm) Riverhurst Durum % Canola % Flax % Luck Lake Durum % HSW % Flax % All sites average %
40 Irrigation Water Management Results indicate that farmers irrigate less than what is required for optimum production Indicate that irrigation is starting late
41 2012 Irrigation Agronomic and Economics Aiming to release it at crop production show
42 Any Questions? Thank you!