Plant Nutrient Management. Dave Franzen PhD North Dakota State University Extension Soil Specialist
|
|
|
- Jacob Hodge
- 5 years ago
- Views:
Transcription
1 Plant Nutrient Management Dave Franzen PhD North Dakota State University Extension Soil Specialist
2 All North Dakota crops require the same 14 essential nutrients North Dakota soils supply most these nutrients Some crops are able to extract or use more or less of these nutrients than others
3 Wheat/small grains- N, P, maybe K, S, Cl Corn N, P, K, S, Zn Soybean P, maybe K, S Dry bean N?, P, maybe K, S
4 Canola N, P, maybe K, S Sunflower N, P, K, S Flax N, S, Zn Field pea/lentil P, maybe K, S
5 How should I plan for Yield Goal? Yield Goal is an outmoded term that implies what you want for Christmas. A better method of determining rate is What is the historic yield potential of the field or part of the field? Yield Potential This question has a similar answer regardless of recent weather trends
6 Exception- Barley If we go into spring dry, reduce your yield potential by going to western recs Example- Yields the last few years have been bu/acre. Rec- 120 lb N Western recommendation- 96 lb N/acre

7 2 1

8
9 Urea-N placement on surface is risky. Agrotain can delay urease activity about 10 days. NBPT is the only chemical that has proven to be practically effective against urease. Put your urea under the soil surface in no-till to avoid hefty losses.
10 Carrington, spring wheat, urea. Timing Yield, bu/a Protein, % Fall, incorporated Nov. frost, not frozen Dec. frozen March, frozen April, seeding LSD 5%
11 (Research by R.J. Goos, in Franzen et al., J. Plant Nut 2011)
12 Experiment 5 Goos, 2012
13 Per Cent Grain Protein Yield, bu/acre Greenseeker 4-5 leaf Spring Wheat INSEY vs Yield, 2 sites 2013 y = -5E+08x 2 + 1E+06x R² = Greenseeker INSEY Crop Circle Red Edge NDVI INSEY, Spring Wheat, Flag leaf, 2 Sites/Varieties y = ln(x) R² = Crop Circle Red Edge NDVI INSEY
14 Per Cent Protein Per Cent Protein Gardner Red Edge NDVI Flag Leaf vs Grain Protein, Gardner, 2013 y = x x R² = Crop Circle Red Edge NDVI Crop Circle Red Edge Spring Wheat Flag Leaf NDVI vs Grain Protein, Valley City, 2013 Response index is about y = e x 11 R² = Crop Circle Red Edge NDVI
15 Canola N- Western N rates are lower than Eastern N rates. Both recommendations are capped. Research shows that fertilizing to the cap provides enough foundational green tissues to support yields up to 4,000 lb/acre The rest is up to management and weather
16 Flax N- Rates are capped to avoid lodging. Rates are sufficient for high yields.
17 Dry bean recs- Apply nothing- Inoculate only- Up to 70 lb N/acre- Irrigated, high yield X YP
18 Dry bean N response curve, NW MN and ND data. Return to N $ $ Return to N, inoculated and non-inoculated trials Inoculated in yellow, non-inoculated in purple RetN0 $ $ $ $ Ret N Inoculated RetN RetN $ $50.00 $ N rate, lb/a
19 Dry bean fertility- P- Lower requirements than soybean K- If soil test is less than 100 ppm S- If soil and weather are favorable for response
20 Dry bean fertility- Zinc- In zone sampled fields only needed in areas lower than 1 ppm. Composite fields, probably up to 2 ppm 2X with zinc chelate (1 qt 12%) should be good. Broadcast 30 lb/acre 36%- will last several years
21 Soybean- N- none needed Inoculation if first time- after a successful introduction it s up to grower preference. Research has shown it s not very important
22 Soybean- P- Broadcast is better than band! Band up to 50 lb/a solid seeded 0 rate if 15 inch rows or narrower
23 Soybean response to broadcast vs banded P. G. Rehm, Nebraska. Ave of 3 site-years. Placement method P 2 O 5, lb/a Broadcast 2 X 2 Band Yield, bu/a
24 Soybean- K- Only if soil test is lower than 100 ppm Micros? Only success has been with Fe-ortho-ortho- EDDHA in furrow without fertilizer Soygreen for alleviation of iron deficiency chlorosis
25 Soybean- S- If fall rainfall, winter snowfall, or early spring rains are high in loam soils or coarser Upper landscape positions or deep low organic matter sands are most susceptible. Elemental S not recommended

26 Cumulative N uptake for corn- from Iowa State Ext. Spec. Rpt 48, 1986
27 Relationship of total known available N to corn yield, all sites, y = -6E-05x x R² =
28 2 sites, one year, both long-term no-till
29 Corn Yield, bu/acre Corn Yield vs Total Known Available N West River y = 3E-05x x R² = Total Known Available N, lb/acre
30 Return to N, $/acre $ Return to N with $6 corn, 50 cent N, West-River Sites $ $ $ $ $ $ $ $ N rate, lb/acre
31 In a dry year is deep-banded fertilizer P and K better than surface or near-surface applications?
32 6 inches deep
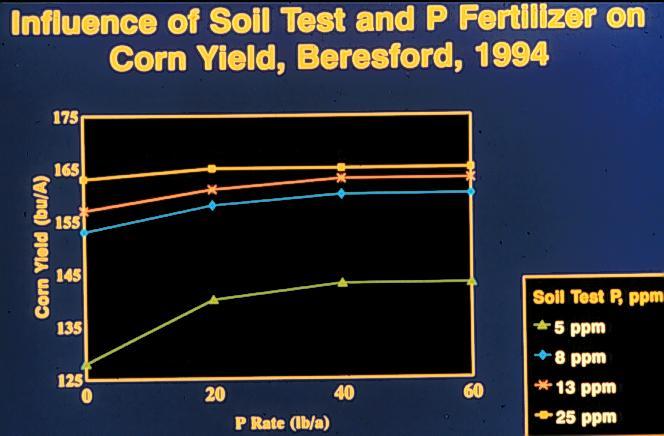
33 P Placement Corn Yield, bu/a None 102 Starter* 153 Deep Band 146 Broadcast 166 *Starter and Deep Band, 50 lb P 2 O 5 - Brcst 100 lb P 2 O 5 P Placement on initially low testing (3 ppm) soil Minnesota- from Randall, 2006
34 Corn yield with in-furrow , *Conventional tillage *Soil : 124 lb N/acre prior to planting; 5 ppm (L) P (Olsen) Carrington, Rate Gal/ac Yield Bu/ac No difference in plant stand among fertilizer rates P. Hendrickson
35
36 Don t skimp on starter P for wheat and barley Apply chloride for malting barley especially if soil test is low. Increases plump and helps to reduce effect of lower barley yield due to reduced kernel size.
37 Wheat yield increase from broadcast or Banded P. Average of six sites, Zubriski, P 2 O 5 applied, lb/a Banded with seed Broadcast
38 Banded P vs Broadcast in Wheat, Rasc, MB Rate of P 2 O 5, lb/a 0 25 banded 25 brdcst Wheat yield, bu/a 50 banded 50 brdcst Similar in size of response (2-4 bu/acre) higher than broadcast in SD, ND. (about 10% yield increases, consistently)
39 Banded vs Broadcast P in Barley, Bailey, MB Rate of P 2 O 5, lb/a Broadcast Banded 1X1 Yield, bu/a
40 Broadcast vs banded with seed, vs banded near seed in Canola Rasc, MB Rate of P 2 O 5, lb/a Broadcast Banded w/seed Banded 1X1 Yield, bu/a
41 Zinc- Research has identified four ND crops with zinc deficiencies- Potato Corn Dry edible beans Flax
42 Typical corn responses to low zinc (less than 1 ppm) would be about 10%. Without zinc example- 140 bu/acre With zinc example 154 bu/acre $ benefit@ $6/bu corn- $84/acre Cost of zinc banded- 1 qt/acre- ~ $5/acre/yr 30 lb 36% zinc ~ $30/acre would last about 10 years.


43
44 Manganese? Most recent Mn research comes out of Michigan, northern Indiana and Ohio, where Mn problems have been seen for decades. Goos has explored Mn problems in this state and has not crossed one yet. Zubriski found no response in sunflower at four locations in 1981.
45 Economics of manganese in North Dakota Response- 0 Cost- $5-20/acre
46 Iron? Iron chlorosis can be seen in most crops if the soil conditions are high in carbonates and the environmental conditions are cold, wet, possibly with salts. In most crops, the areas affected are small and the environment or soils would not support good yields even if the chlorosis were gone.
47 Iron? Rating crops on iron susceptibility, Soybean most susceptible Sugarbeet responses to Fe seen Dry bean symptoms in high carbonate/salt Flax symptoms in high carbonate (salt?) soils The only crops worth considering are soybean and maybe sugarbeet
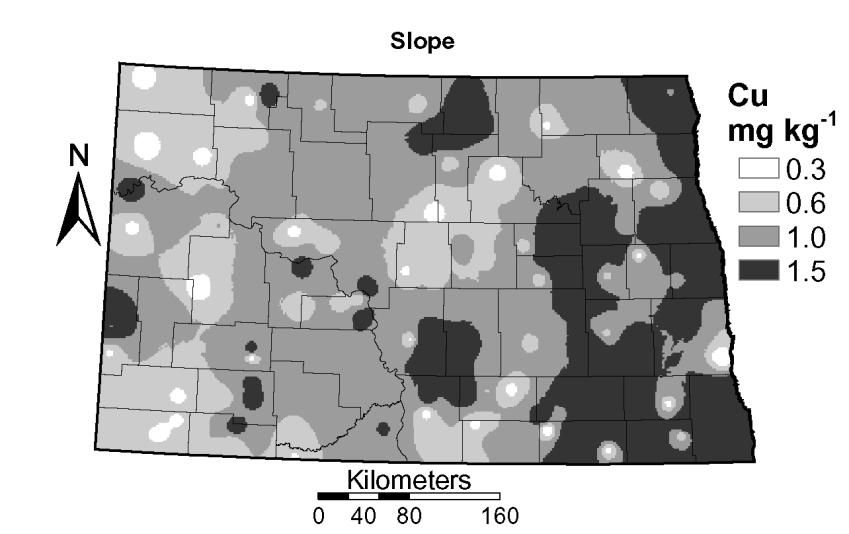
48 Copper? Sunflower- Zubriski- 4 locations, no response, 1981 Spring wheat/durum- Franzen et al., Yield increased at 5 of 20 sites, and reduced at 2. Fusarium incidence and severity decreased at 4 sites. Use of copper is at best site-specific on sandy, low organic matter soils, with low Cu. Copper sulfate at 5 lb/acre is a good soil treatment.
49 Economics of copper in wheat- Whole field- most fields only contain inclusions of deep low organic matter sandy soils, anywhere from 0-20%. Example field, 10% susceptible soils. 160 acres total. Increased wheat yield 10 bu/acre on 16 acres- Wheat at $8/bushel. Field response- $128 Cost- 5 lb $2/lb CuSO4-20% $50. Profitable site-specific, not whole-field.

50

51

52

53


54
55 Plant Analysis Do s and Don ts
56 Plant analysis, combined with a soil test, can be very helpful in diagnosing nutrient deficiencies during the season. Early sampling can lead to yield improvements. Later sampling in non-irrigated land is a kind of post-mortem.
57 Critical level ranges, corn ear leaf silking to tassel Nutrient Melsted et al Jones 1967 Neubert et al UW soil lab N% P, % K% Ca% Mg% Zn, ppm B,ppm Mn, ppm Fe, ppm Cu, ppm
58 No simple and reliable tissue test exists to identify the conditions that increase the chance of corn or soybean response to P and K fertilization. In spite of many field trials in Iowa, we have not been able to identify a useful critical or optimal P or K concentration in plant tissue. Antonio Mallarino, Iowa State, 2010.

59 Non-relationship of corn yield to small plant or earleaf P or K in Iowa, Mallarino, 2010.

60 Non-relationship of soybean yield to small plant and fully extended leaf P and K. Mallarino, 2010.
61 In a recent meeting of the North Central States Extension Soil Specialists, including Missouri, Illinois, Wisconsin, Indiana, Ohio, Nebraska, South Dakota, North Dakota, Minnesota, Iowa and Michigan, not a single researcher or lab manager would be willing to make fertilizer recommendations solely on a plant analysis concentration, particularly micronutrients.
62 Take a soil sample from the correct depth from the poor and good area and keep them separate. Soil sample + plant sample Good area sample Bad area sample Soil sample + plant sample
63 Corn Plant analysis report- Good area Zinc low Phosphate high Nitrogen high Sulfur OK Corn Soil analysis report- Good area Zinc medium Phosphate high Nitrogen high Sulfur high Bad area Zinc low Phosphate High Nitrogen High Sulfur low Look for the common problem Bad area Zinc medium Phosphate High Nitrogen High Sulfur low
64 Situation- Spring wheat, very good growth, green, healthy, soil water good, salts low, cool weather. Flag leaf stage- Plant analysis- Copper low zinc low manganese low sulfur OK nitrogen OK Soil test 0.5 ppm (medium) 0.5 ppm (medium) 4 ppm (high) not useful not useful right now Recommendation- no micros needed. In a high-yielding environment, micronutrient levels will be at the lower end of the scale naturally. No supplements are needed in these nutrients based on recent research in the region.