efficiency, livelihoods and the environment Mario Herrero, Petr Havlik, An Notenbaert, Mariana Rufino, Ezequiel Gordon
|
|
|
- Peter Fowler
- 5 years ago
- Views:
Transcription


1 Sources of statistics and activity data for Sub- Saharan Production Africa livestock systems GHG for inventories the future: balancing What is trade-offs out there between that could food use? production, efficiency, livelihoods and the environment Mario Herrero, Petr Havlik, An Notenbaert, Mariana Rufino, Ezequiel Gordon M. Herrero and P.K. Thornton WCCA/Nairobi Forum Presentation 21 st September 2010 ILRI, Nairobi GRA-ILRI-CCAFS SSA GHG emissions workshop Nairobi September 2012
2 Background Need good quality data for deriving good emission factors for livestock There is a need for disaggregation of emission factors by system to design better mitigation options Several regional/global and local datasets that could be useful for this
3 What data do we need to do this? Knowledge of: 1. the prevailing production systems and their spatial distribution 2. the numbers of livestock in each production system 3. Feeding systems: what animals consume throughout the year (and its quality) 4. The relationships between what animals consume, produce and excrete 5. Manure management systems 6. How systems and livestock populations will change in time (intensification climate change and others) as a result of increases in demand for livestock products
4 Classifying livestock systems Simple but robust system types Agro-ecological conditions Management Different productive characteristics Standardisation and comparison
5 A Global Livestock Classification System Seré and Steinfeld (1996) Grassland-based systems (LG) Tropical highland/temperate (T) LGT Humid-subhumid (H) LGH Arid-semiarid (A) LGA Mixed systems (M) Irrigated (I) Tropical highland/temperate (T) MIT Humid-subhumid (H) MIH Arid-semiarid (A) MIA Rainfed (R) Tropical highland/temperate (T) MRT Humid-subhumid (H) MRH Arid-semiarid (A) MRA Landless (LL) Monogastrics (M) LLM Ruminants (R) LLR Thornton et al 2002
 Other >60 LGP >60 LGP <60 LGP >20 ppsk <20 ppsk Rangeland Mixed Systems LG <10% irrigated >10% irrigated Mixed Rainfed Mixed Irrigated MR MI Thornton et al")
6 1 Decision tree for mapping the classification > 450 persons per sq km (ppsk) < 450 persons per sq km (ppsk) City lights LMS No city lights LS Cropland Rangeland Other (as defined by the global land cover characteristics database) Other >60 LGP >60 LGP <60 LGP >20 ppsk <20 ppsk Rangeland Mixed Systems LG <10% irrigated >10% irrigated Mixed Rainfed Mixed Irrigated MR MI Thornton et al 2002

7 Thornton et al 2002


8 Livestock production systems in Sub-Saharan Africa - Robinson et al 2011 (FAO/ILRI)
9 Bovine density 2000 Gridded livestock of the world (FAO) Cattle, sheep, goats, buffalos, pigs, poultry No split between dairy and meat Poor spatial allocation of monogastrics
10 Crop distribution layers: Spatial production allocation model 20 global crops Developed by IFPRI Spatial resolution of 18 km Useful for calculating stover amounts and grain production as feeds Necessary to supplement this information with local knowledge on how animals are fed GEOshare layers (Ramankutty et al )


11 Stover production It is about crop residues: -Only feed growing in quantity -Not competing for the use of land...but how to use it better...it is of poor quality


12 Global rangeland productivity East and Southern African rangelands support modest levels of animal production...a livestock revolution will not occur in these systems in the magnitude required to meet consumption Herrero and Thornton 2009

13 Map 1. Global metabolisable energy intake from ruminants -Feed from all sources: grasses, rangelands, grains, crop residues, cut and carry forages, etc Herrero et al 2012 forthcoming
14 Estimating productivity
15 Developing spatially disaggregated global livestock productivity and emissions maps Sere and Steinfeld systems 28 regions 8 systems Literature + SPAM + rangeland maps Split dairy / meat with herd dynamics models Dairy cattle Beef cattle Dairy shoats Meat shoats Poultry pigs Diets -Grass -Crop residues -Grains -Other feeds Productivity -milk/meat GHG emissions -methane, N2O Excretion - manure, N, C GLW Animal species and numbers Lit review on mortalities and reprod parameters Animal numbers FAO Commodity balance sheets Harmonisation with FAOSTAT at national level Production stats
16 Some FAO products to consider FAOSTAT National data Crop and livestock production, animal numbers, inputs Incomplete reporting Should be considered a starting point in the absence of local data FAO Commodity balance sheets Gives an idea of main feed resources (grains, by-products, others) Gives basic feed trade data also incomplete reporting
17 Estimating what animals consume Diets estimated for each region from experiments, expert knowledge and literature by: Production system X season (wet or dry) Type of feed changed regionally to reflect quality differences Examples: Stover in East Africa assumed to be maize while for West Africa we used millet Cut and carry assumed to be Napier in East Africa but groundnut hay in Southern Africa
18 Estimating what animals consume Need quantity and quality for each species, system, animal group system dry savanna humid savanna Subtrop. savanna stover cut and carry weeds + others grains LA X LH X LT X MRA X X MRH X X X X X MRT X X X X X Stover = rice straw Cut and carry = napier grass
19 Estimating what animals consume Regional splits Diets estimated for each region from experiments, expert knowledge, household surveys and literature by: Species X Production system X season (wet or dry) Type of feed changed regionally to reflect quality differences Examples: Stover in East Africa assumed to be maize while for West Africa we used millet Cut and carry assumed to be Napier in East Africa but groundnut hay in Southern Africa Modelling of animal production Tier 2/3 or real systems data!
20 The RUMINANT Simulation model Dynamic simulation model of digestion in ruminants (Herrero et al 2004) largely based on IPCC methods Predicts intake, production (milk, meat), and excretion (faeces and urine) using a dynamic model of digestion (Illius and Gordon 1991) Prediction of intake Predicts metabolism end products (METHANE, Volatile fatty acids, etc) Uses known stoichiometric relationships Widely validated in the tropics Used in a range of studies with cattle, sheep and goats predicted intakes (g/kg BW 0.75 ) soto pred l and m pred shem pred kaitho pred manyuchi pred Kariuki pred Euclides pred observed intakes (g/kg BW 0.75 ) 140 j and h pred l and f pred fall pred
21 Global milk production Herrero et al 2012 forthcoming
22 Other dimensions
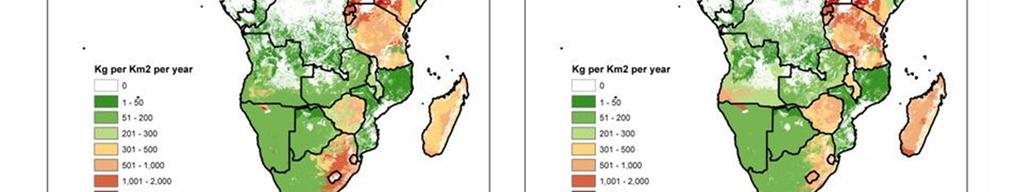
23 Map 5. Global manure production from domestic livestock (ruminants and monogastrics)


24 Map 5. Global nitrogen excretion from bovines Global manure production from domestic livestock (ruminants and monogastrics)

25 Global greenhouse gas efficiency per kilogram of animal protein -Includes emissions from enteric fermentation and manure management -Included: cattle, shoats, pigs and products: milk, beef, pork. Herrero et al (PNAS forthcoming)

26
27 top 20 methane emitters (million kg) Africa - Shifts in methane production as systems evolve to 2030 linking livestock numbers to SRES scenarios important to evaluate mitigation strategies Ethiopia MRT Sudan LGA Sudan MRA Nigeria MRA Tanzania MRA Ethiopia MRA Kenya MRT South Africa LGA Madagascar LGA Somalia LGA Burkina Faso MRA Tanzania MRH Nigeria MRH South Africa LGT Kenya LGA Mali MRA Uganda MRH Zimbabwe MRA South Africa MRA Ethiopia LGA top 20 methane emitters (million kg) Sudan MRA Nigeria MRA Sudan LGA Ethiopia MRT Ethiopia MRA Tanzania MRA Burkina Faso MRA Nigeria MRH Uganda MRH Mali MRA Swaziland LGA Madagascar LGA Botswana LGA Uganda MRA Madagascar MRA Kenya MRT Ethiopia MRH Mali LGA Ethiopia LGA Chad MRA
28 Conclusions Better data comes out of integrated methodologies: Spatial products Experiments and real measurements Household-level data (surveys) Expert knowledge Livestock models Census and other statistics
29 Research needs Need better local data to supplement existing efforts (how to collate it, standardise it, etc) Need robust measurements (how to make them representative? We don t know where smallholders are, nor their share of production Spatial distribution of animals can be improved notably monogastrics (we don t know where they are) Joint crop and livestock classification (real SPAM) Proxies for systems intensification that are robust cross landscapes Linkages to market access Need better spatial coverage of fodders (ok for stover and grass) we only account spatially for 60-70% of feed in some systems Need to refine productivities and yield gaps work and constraints to production
30 Mitigation moving beyond inventories Mitigation needs to go beyond inventories to understand options at the household level To understand trade-offs and synergies between adaptation and mitigation Competing use of resources Upscaling strategies and mitigation potentials of specific regions
31 Thank you