Application of Geospatial Technologies in Developing Climate Change Adaptation Tracking Mechanism (ATM) in Bangladesh
|
|
|
- Randell Hart
- 5 years ago
- Views:
Transcription
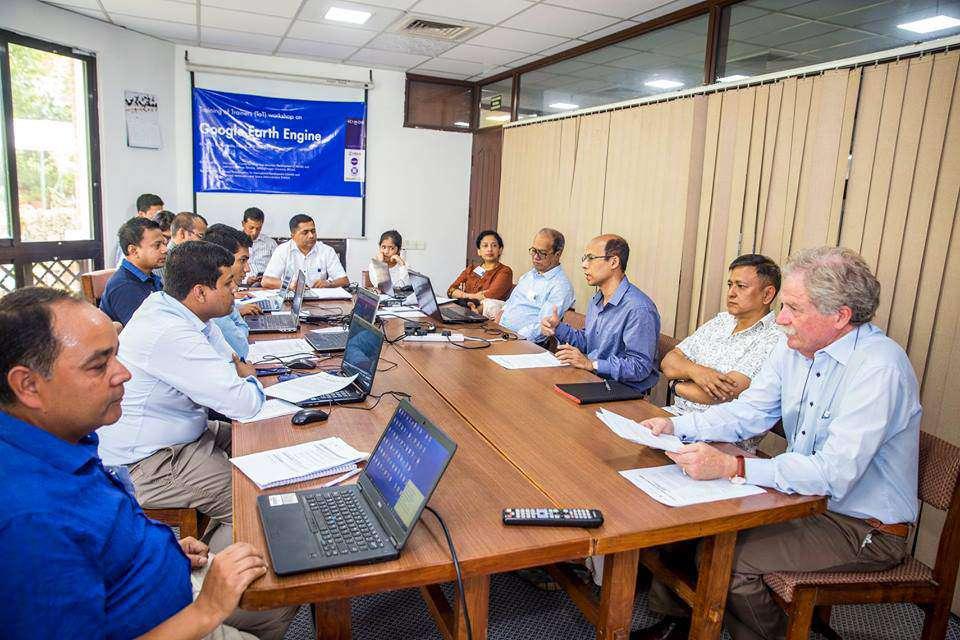
1 Application of Geospatial Technologies in Developing Climate Change Adaptation Tracking Mechanism (ATM) in Bangladesh Sheikh Tawhidul Islam, PhD (Durham, UK) Professor Department of Geography and Environment Director Institute of Remote Sensing Jahangirnagar University, Bangladesh. and Krishna Prosad Mondal
2

3 BANGLADESH HAZARD PROFILE DROUGHT Affects 2.3 m ha crop land. Loss of grazing fields, dried up ponds, water shortage. In 2006, reduced food grains by 1 million tons. FLASH FLOOD Damages standing crops, infrastructures and facilities. Unpredictable, uncertain. FLOOD Inundates 20% (normal years) to 75% of land area during monsoon, increases river erosion, breaches embankments, damages infrastructures. Loss of crops, fisheries, livestock, biodiversity. SALINITY INTRUSION Damages biodiversity, crop lands, livelihoods, safe water sources. Spreading intrusion from 0.75 to 1.5 m ha (2009); 53% of coastal area affected. Projected displacement: 6-8 million people by 2050 CYCLONE Remains the deadliest, most destructive hazard. Recurring events, lingering aftermath, complex recovery. Improved preparedness (CPP, shelters, embankments). AND CLIMATE CHANGE HAZARDS, EARTHQUAKES, FIRE BREAKOUTS, INFRASTRUCTURE COLLAPSES, ETC. Comprehensive Disaster Management Programme (CDMP II) Ministry of Disaster Management & Relief
4 (36.20%) 110 (4.76%) 28 (1.21%) 134 (5.82%) 615 (26.72%) Crops Livestock Poultry Fishery Land degradation 396 (17.19%) Dwelling house, kitchen, cowshed 187 (8.1 %) Homestead groves Figure: Loss and damage caused by disasters ( ) in different sectors (figures in million USD). Source: BBS Figure 9: Number of affected people from various types of disasters drawn from the sample population (BBS 2015).

5


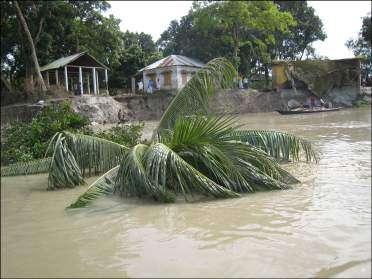
6 Figure: Physical context of Chouhali study site, Sirajgonj district. Physical context of Chilmari study site, Kurigram district.
7 22 30'0"N 90 0'0"E 90 30'0"E 91 0'0"E 91 30'0"E 22 0'0"N 22 0'0"N 22 30'0"N 23 0'0"N ¹ Legend 2000s 1930s 1760s Kilometers 90 0'0"E 90 30'0"E 91 0'0"E 91 30'0"E Figure 9: Block wise accretion-erosion and changes in the GBM estuary during the last 240 years. Source: Rashid et al '0"N


8

9


10
11 Data Relating to Loss and Damage happened due to Disaster Impacts , Total damage in '000 USD, EM-DAT 2007 Flood Flood Storm Storm Storm Flood Storm Storm Flood million USD Total Damage and loss caused by disasters ( ), BBS Disasters Million BDT Million USD Drought Flood Water logging Cyclone Tornado Storm/Tidal surge Thunderstorm River/Coastal erosion Landslides Salinity Hailstorm Others Value of total loss and damage
12 Policies NPDM (National Plan for Disaster Management) Disaster Management Act Standing Orders on Disasters National Adaptation Programme of Action BCCSAP (Bangladesh Climate Change Strategy and Action Plan) CIP (Climate Investment Plan) 7 th Five Year Plan SDG attainment plan (BESF)
13 Loss and damage information collected by the D Form of DDM Information Description Information Description category category 1 Name of Upazilla and district affected 15 Damage of mobile phone towers disasters 2 Number of wards/unions affected 16 Damage of structures of religious institutions 3 Affected area in square kilometres 17 Information on the damage of road networks of different categories 4 Affected people (man, women, children) 18 Number of bridge and culvert damage 5 Physically challenged persons (man, women, 19 Damage of embankments in kilometres children) 6 Affected households (partial, total) 20 Affected forest areas in hectares 7 Number of affected house (concrete, semiconcrete, 21 Number of affected educational institutions thatch made) 8 Affected disaster shelters (partial, total) 22 Affected industries (agriculture and nonagriculture) 9 Value of livestock lost (goats, lamb) 23 Number of affected tubewells 10 Value of livestock lost (cow, buffalo) 24 Affected toilets/latrines 11 Value of birds/poultry lost (chicken, duck) 25 Affected water reservoirs in numbers 12 Affected crops and seedbeds in hectares 26 Affected health centers (hospitals, clinic, community health centers) 13 Damage of other farms (e.g. shrimp hatchery etc.) 27 Loss of fishing boats and gears (boats, trawlers, fishing nets) 14 Damage of power lines (partial, total)


14 Provided assistance to MoDMR in using high spatial resolution drone image in disaster impacts recovery prcess in Banshkhali (Chittagong).
15 Coordination Mechanisms of Climate Change Investments in Bangladesh.
16 ATM Architecture Category Primary key in the user interface software 1. Vulnerability Meteorological data Variables Statistical treatment Category of divisions Temperature Rainfall - Characteristics - Average/Pattern - Threshold (monthly, seasonal and yearly) - Anomalies - Projected scenario/prediction (statistical down scaling: GCM simulation) - Interpolation By year By area/station By Agro-ecological zones By hazard types 2. Adaptation interventions Hazard and disaster impacts Infrastructure Land use pattern including land elevation Vulnerability and interventions Floods (seasonal) Floods (flash type) River bank erosion Waterlogging Cyclone Drought Salinity - Hazard maps - Change in the river bank line - Scenario prediction mapping By year By administrative boundary By Agro-ecological zones Roads - By administrative boundary Rails Embankments Social institutions Application of drone technologies - Reference flood level for local level planning By year Application of low resolution DEM (SRTM or Sentinel data of ESA) By administrative boundary By Agro-ecological zones Household (HH) Community (CBO, Local Government) - Locational information of the household, photograph and mobile phone number - Database (vulnerability, sensitivity and exposure) against HH ID - Locational information, information about the representation and mobile phone number - Database (vulnerability, sensitivity and exposure) against HH ID Baseline Interventions Impacts Baseline Interventions Impacts 3. Tracking Measuring and Reporting Major project activities in the area Numeric reporting Qualitative reporting Spatial analysis (converting to kml) At local level Project attributes Pre project During project Post project scenario Allocation of funds Vulnerability, sensitivity and exposure of the HH and local institutions CRA/RRAP for the union MoDMR reporting (based on D form) Case stories Production of maps based on user needs and queries - Distributions of HH with specific financial allocations (may be range of value is used) - Allocations of funds to different social/local institutions By adaptation intervention category By locations, hazard types
17 ATM (Data and Methods) Climate Change Risks (variability and change in the climatic variables) Erratic rainfall; shifting precipitation pattern (Statistical assessment and reporting; using R) Heat spells over threshold level (Statistics using R, modelling, thermal band of RS) More floods, untimely floods (use of series of satellite images, DEM/drone and reporting, OSM) Increased river bank erosion (use of series of satellite images and reporting)
18 ATM (Data and Methods) Increased, prolonged drainage congestion (GIS/spatial analysis and RS) Salinity intrusion into surface water, ground water and soil (GIS, RS, Secondary data analysis) More cyclone, storm surges with higher intensities (RS, DEM/drone) Reduced water availability for households and agricultural crops (RS, GIS) Also information about land topography, settlements/village, physical information, institutions, commonplaces, land use, disaster prone/affected areas


19 19


20 20

21 Components of FDES 1. Environmental Conditions and Quality 2. Environmental Resources and Their Use 3. Residuals 4. Extreme Events and Disasters 5. Human settlements and Environmental Health 6. Environmental Protection, Management and Engagement
22 Objectives of BESF (i) identifying main quantifiable aspects of the environment, (ii) identifying components, sub-components and topics that are relevant and statistically feasible according to defined national needs and priorities, (iii) facilitating the development of a national programme of environmental statistics, (iv) contributing to the assessment of data requirements, sources, availability and gaps, (v) guiding the development of databases that can be used for multiple purposes and (vi) assisting the co-ordination and organization of environmental statistics given the inter-institutional nature of the domain.
23 Reports to be developed proposed in the BESF ( ) 1. Compendium of Environmental Statistics 2. Compilation of Resource Accounts following SEEA (on land/soil, water, forests, natural gas, energy, fish) 3. ClimateChangeand Natural Disaster-related Statistics 4. Compilation of Social Accounting Matrix 5. Poverty Environment Accounts (PEA) in light with SEEA 6. Experimental Ecosystem Accounts (EEA) in light with SEEACF 7. Household Survey of Health and Sanitation in Disaster Prone Areas of Bangladesh 8. Urban/RuralWaste Generation Recycling and Management survey 9. Environmental Protection and Resource Management Expenditure Accounts 10. Disaster Risk Reduction Expenditure Accounts 11. ClimateChangeand Natural Disaster Impacts Vulnerability Index 12. Pre-crisis DataGathering Tools as BaselineInformation 13. Climateand Natural Disaster Induces Survey 14. Urban/RuralWater generation Useand Managementsurvey 15. Developing a Web Based Data Sharing Reporting and Ensuring Access to Stakeholders


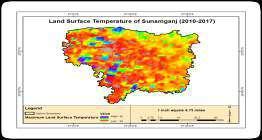
24 Temperature analysis of 40 years by using GEE


25 Rainfall and Temperature Dynamics

26 Flood Monitoring in Bangladesh

27 Chart NDVI Over Time
28 Chart NDVI Over Time

29 Compute NDVI

30 Terrain Modeling

31 Terrain Modeling
32 Terrain Modeling

33 Flood Monitoring