Monsanto Learning Center at Gothenburg, Nebraska 2014 Demonstration Reports
|
|
|
- Phillip Harris
- 5 years ago
- Views:
Transcription


1 Monsanto Learning Center at Gothenburg, Nebraska 2014 Demonstration Reports

2 MONSANTO the LEARNING CENTER Follow us! Scan the codes below to visit our website, and follow us on Facebook and Twitter for information and resources all year. Website: Page 2 / 2014 Demo Report

3 Welcome to the 2014 Demonstration Reports from your Learning Center in Gothenburg, NE. Overall, the weather was sufficient for good crop growth with the center receiving seven inches of rain in June followed by a dry spell in July and then 5.5 inches mid-august into September. Unfortunately, the Learning Center also had three wind/hail events that caused damage to the crops at different growth stages and reduced yield potential. Throughout the year we hosted over 4,500 guests from multiple countries who experienced our demonstrations. There were some unique takeaways from the research this year such as the effect of cover crops on reducing the impact of Goss s Wilt and the effect of grazing and baling residue on limited irrigated corn. To access the Learning Center s website please use the QR codes on the left with your mobile device (or use this address: If you have any questions feel free to contact me at brian.olson@monsanto.com. As always we welcome and look forward to your visit in The Learning Center Team is gearing up for another successful season with demonstrations that will be valuable your operation. To schedule a visit with a group of any size please contact Khris Jinks (khris.a.jinks@monsanto.com) or Ashley Trimble (ashley. trimble@monsanto.com) at (308) We d enjoy the opportunity to show you around the field and the classroom if you are in the area. Thanks, The Gothenburg Learning Center Team Monsanto Learning Center at Gothenburg, NE / Page 3
4 MONSANTO the LEARNING CENTER Table of Contents Effects of Planting Density on Dryland Corn Yield 5-7 Cover Crop Affect on Goss s Wilt 8-9 Drought Mayhem: Corn and Soybean Variable Rate Irritaion - Density by Irrigation Corn Product by Water Performance on the Irrigated HIgh Plains Corn Response to Timing of Water Application Effect of Residue Removal on Irrigated Corn Yields Fall and Early Spring Options to Control Kochia Impact of Additive Management Practices on Corn Yield Potential Irrigated Soybean Density Dryland Soybean Row Spacing Delayed Harvest Loss of Irrigated Soybean Page 4 / 2014 Demo Report
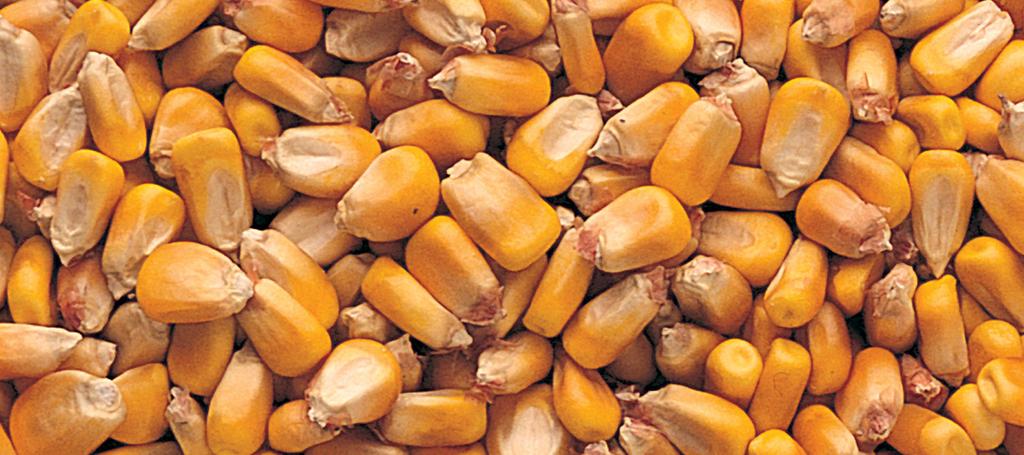
5 Effects of Planting Density on Dryland Corn Yield Seeding rates for corn in Nebraska under dryland conditions have ranged from approximately 8,000 to 30,000 seeds/ acre. Water requirements of corn may decrease if the population is less than 18,000 plants/acre. Corn yield potential may increase from 6 to 12 bu/acre for each additional inch of soil water beyond the 8 to 11 inches needed for initial grain development. Many agronomists have found that maximum production is reached with a 0.5 pound ear weight, with row spacings of 20 to 36 inches. Study Guidelines A two-year corn demonstration trial was conducted at the Monsanto Learning Center near Gothenburg, NE to determine the best planting density for dryland corn using Genuity DroughtGard Hybrids corn products. Three DroughtGard Hybrids products were planted in 2013 and 10 products were planted in Planting dates were May 7, 2013 and April 25, The 2013 trial was planted into wheat stubble, and the 2014 trial was planted into soybean stubble. Over both years, weeds were uniformly controlled using a residual weed control program. The study was set up as a small plot research trial with 3 replications. All corn products were tested at all seeding rates. Yields were averaged across products as there was no statistically significant productby-seeding rate interaction. In 2013, the Learning Center experienced cooler temperatures in April and May with inches total rainfall for the growing season. In 2014, the Learning Center experienced good growing conditions in May, June, and August while July was dry with only 0.5 inch of moisture recorded during this month. Total rainfall for the 2014 growing season was inches. Results Figures 1 and 2 show the average corn yields by seeding rates in the 2013 and 2014 trials. The 26,000 seeds/acre seeding rate produced the highest yields in both years of this trial. Figures 3 and 4 outline the return on investment for the 2013 and 2014 trials assuming $ for an 80,000 kernel unit bag of Genuity DroughtGard Hybrids Corn Seed. In both years of this trial, the 26,000 seeds/acre seeding rate resulted in the greatest return on investment. Figure 5 shows the comparison of ears between two different products at three different seeding rates LSD (0.1) = Yield (bu/acre) Figure Average Corn Yield by Seeding Rate Seeding rate (seeds/acre) Monsanto Learning Center at Gothenburg, NE / Page 5
6 MONSANTO the LEARNING CENTER Effects of Planting Density on Dryland Corn Yield Yield (bu/acre) LSD (0.1) = Figure Average Corn Yield by Seeding Rate Seeding rate (seeds/acre) 169 Seeds/acre Seed Cost/acre Bu/acre $/bu $/acre Figure Returns Assuming $ for 80,000 kernel unit bag of Genuity DroughtGard Hybrids Corn Seed Figure Returns Assuming $ for 80,000 kernel unit bag of Genuity DroughtGard Hybrids Corn Seed Page 6 / 2014 Demo Report Return less seed cost/acre 12,000 $ $3.50 $ $ ,000 $ $3.50 $ $ ,000 $ $3.50 $ $ ,000 $ $3.50 $ $ ,000 $ $3.50 $ $ Seeds/acre Seed Cost/acre Bu/acre $/bu $/acre Return less seed cost/acre 14,000 $ $3.50 $ $ ,000 $ $3.50 $ $ ,000 $ $3.50 $ $ ,000 $ $3.50 $ $ ,000 $ $3.50 $ $ ,000 $ $3.50 $ $470.38

7 Effects of Planting Density on Dryland Corn Yield Product A Product B 18,000 seeds/acre 26,000 seeds/acre 34,000 seeds/acre Figure 5. Ear Comparisons by Seeding Rates Key Messages Overall, this trial provided the following findings: In both years, the highest observed yield was recorded at the 26,000 seeding rate. Yield reached a plateau between 26,000 and 30,000 seeds/acre and then declined in 2014 at 34,000 seeds/ acre. In this study, the optimum seeding rate to use for maximizing return on investment was 26,000 seeds/acre. Source Klein, R.N. and Lyon, D.J. Recommended seeding rates and hybrid selection for rainfed (dryland) corn in Nebraska. UNL Extension. NebGuide G2068. Legal The information discussed in this report is from a single site, 2-year, 3-replication research or demonstration trial. This informational piece is designed to report the results of this demonstration and is not intended to infer any confirmed trends. Please use this information accordingly. Monsanto Company is a member of Excellence Through Stewardship (ETS). Monsanto products are commercialized in accordance with ETS Product Launch Stewardship Guidance, and in compliance with Monsanto s Policy for Commercialization of Biotechnology- Derived Plant Products in Commodity Crops. Commercialized products have been approved for import into key export markets with functioning regulatory systems. Any crop or material produced from this product can only be exported to, or used, processed or sold in countries where all necessary regulatory approvals have been granted. It is a violation of national and international law to move material containing biotech traits across boundaries into nations where import is not permitted. Growers should talk to their grain handler or product purchaser to confirm their buying position for this product. B.t. products may not yet be registered in all states. Check with your Monsanto representative for the registration status in your state. IMPORTANT IRM INFORMATION: Genuity RIB Complete corn blend products do not require the planting of a structured refuge except in the Cotton-Growing Area where corn earworm is a significant pest. See the IRM/Grower Guide for additional information. Always read and follow IRM requirements. Individual results may vary, and performance may vary from location to location and from year to year. This result may not be an indicator of results you may obtain as local growing, soil and weather conditions may vary. Growers should evaluate data from multiple locations and years whenever possible. ALWAYS READ AND FOLLOW PESTICIDE LABEL DIRECTIONS. Roundup Ready crops contain genes that confer tolerance to glyphosate, the active ingredient in Roundup brand agricultural herbicides. Roundup brand agricultural herbicides will kill crops that are not tolerant to glyphosate. DroughtGard, Genuity, RIB Complete, Roundup Ready 2 Technology and Design, Roundup Ready, and Roundup are trademarks of Monsanto Technology LLC. Leaf Design is a registered trademark of Monsanto Company. Respect the Refuge and Corn Design and Respect the Refuge are registered trademarks of National Corn Growers Association. All other trademarks are the property of their respective owners Monsanto Company JMG Monsanto Learning Center at Gothenburg, NE / Page 7


8 MONSANTO Background the LEARNING CENTER Cover Crop Affect on Goss s Wilt Are there cultural practices farmers can use to decrease the impact of Goss s Wilt on yield potential? Cover crops may provide a benefit, but it is dependent on the timing and amount of rainfall. Soil moisture depletion in dry years May have a good fit with limited to full irrigation in certain situations Study Guidelines A corn demonstration trial was conducted at the Monsanto Learning Center near Gothenburg, NE to evaluate the potential to use cover crops to decrease the impact of Goss s Wilt on corn yield potential. Three corn products with different tolerance ratings for Goss s Wilt were used in the study: a tolerant product, a product with intermediate tolerance, and a susceptible product. The study was a split-plot design with 6 replications. Each corn product was planted into an area with wheat cover crop residue or an area with no wheat cover crop. Winter wheat was seeded on November 5, 2013, immediately after corn harvest to serve as the cover crop prior to planting corn in Wheat was terminated at planting and the residue was used to provide a barrier between the Goss s Wilt infected corn residue from the previous crop and the current corn crop. Corn was planted in a no-till system on May 5, 2014, and standard agronomic practices for the area were implemented with irrigation provided as needed. Goss s Wilt Symptoms Corn leaf infected with Goss s Wilt Goss s Wilt lesions with freckles Goss s Wilt lesions with freckles illuminated by backlighting Page 8 / 2014 Demo Report

9 Cover Crop Affect on Goss s Wilt Results The cover crop provided 20 bu/acre more yield in the plots with the intermediate Goss s Wilt tolerance corn product. Goss s Wilt pressure was extremely heavy due to two mid-season storms with hail, wind, and rain that promoted the onset of the disease. Consequently, the cover crop had no impact on the susceptible corn product most likely because of the extreme Goss s Wilt pressure causing the corn to quickly succumb to the disease. As for the tolerant product, yield potential was not impacted by the cover crop because the corn was tolerant to the high level of Goss s Wilt pressure. Corn Product Response to Goss s Wilt Conclusions A small grain cover crop such as winter wheat, planted immediately after corn harvest and terminated at planting the following spring, may help suppress the impact of Goss s Wilt on corn yield potential for corn products with intermediate tolerance to Goss s Wilt. The wheat cover crop in this study helped delay the onset of Goss s Wilt by 2 to 3 weeks, compared to plots with no cover crop. Based on the results of this study, cover crops may be an additional tool to help manage Goss s s Wilt in irrigated, continuous corn systems. Additional research is needed to confirm these results. Confirm yield response Dry soil moisture conditions Legal Statements The information discussed in this report is from a single site, 6 replication research or demonstration trial. This informational piece is designed to report the results of this demonstration and is not intended to infer any confirmed trends. Please use this information accordingly. Individual results may vary, and performance may vary from location to location and from year to year. This result may not be an indicator of results you may obtain as local growing, soil and weather conditions may vary. Growers should evaluate data from multiple locations and years whenever possible. ALWAYS READ AND FOLLOW PESTICIDE LABEL DIRECTIONS. Leaf Design is a registered trademark of Monsanto Company. All other trademarks are the property of their respective owners Monsanto Company JSC. Cover Crop Affect on Goss s Wilt Yield - bu/acre LSD (0.1) = 12 Cover Crop None 100 Susceptible Intermediate Tolerant Corn Product Goss's Wilt Rating Monsanto Learning Center at Gothenburg, NE / Page 9
10 MONSANTO Background the LEARNING CENTER The proper integration of improved corn genetics and biotech traits, with the implementation of the right agronomic practices can help manage drought and other risks. This study has been conducted for the past five years and is designed to demonstrate agronomic practices that may improve dryland corn yield potential. Study Guidelines A corn demonstration trial was conducted at the Monsanto Learning Center near Gothenburg, NE comparing drought management practices. Randomized complete block design with 5 replications. An additive plot style, from poor drought management to good drought management, was used to identify system responses to each treatment change. Six treatments simulating different management decisions for a dryland production system. Drought Mayhem: Corn and Soybean The Everything Wrong treatment represents practices that would not be recommended in a systems approach to reduce the impact of drought stress on the crop. The other treatments progressively added more stress tolerance and improved agronomics to the system. Corn products (112 day relative maturity) were planted on May 6, 2014 in 30-inch rows at 21,000 seeds per acre (treatments 1 to 5) on corn residue. Planting depth was 2 inches in all plots. Each experimental plot was 65 feet by 8 rows. Each plot was fertilized in early May with 60 lb of phosphorus and 150 lb of nitrogen per acre. Plots were harvested on November 10, 2014 Rainfall for the season included 7 inches in June, 0.5 inches in July, and 5.5 inches in August. Treatment Page 10 / 2014 Demo Report Corn Product* Planting Density Everything Wrong RR2 21,000 Conventional None Weed Control RR2 21,000 Conventional Tillage RR2 21,000 No-till Insect Traits VT3P 21,000 No-till Drought Tolerant Biotech trait Population DGVT2P 21,000 No-till DGVT2P 24,000 No-till Tillage PRE Weed Control POST Weed Control Roundup PowerMAX at V17 corn Roundup PowerMAX + Roundup PowerMAX + Harness + atrazine + Callisto Status at V8 corn Roundup PowerMAX + Harness + atrazine + Callisto Roundup PowerMAX + Harness + atrazine + Callisto Roundup PowerMAX + Harness + atrazine + Callisto Roundup PowerMAX + Harness + atrazine + Callisto Roundup PowerMAX + Status at V8 corn Roundup PowerMAX + Status at V8 corn Roundup PowerMAX + Status at V8 corn Roundup PowerMAX + Status at V8 corn *RR2 = Roundup Ready Corn 2; VT3P = Genuity VT Triple PRO RIB Complete corn blend; DGVT2P = Genuity DroughtGard Hybrids with VT Double PRO RIB Complete corn blend


11 Drought Mayhem: Corn and Soybean 210 Average Yield - bu/acre LSD (0.1) = Everything Wrong Weed Control No-till Insect Traits Drought Tolerant Biotech Trait Drought Management Treatment Impact on Corn Yield Potential Increased Population with Drought Tolerant Biotech Trait 2014 Ear Samples from the Everything Wrong Treatment 2014 Ear Samples from the Drought Tolerant Biotech Trait Treatment* *Genuity DroughtGard Hybrids with VT Double PRO RIB Complete corn blend 2014 Ear Samples from the Weed Control Treatment Monsanto Learning Center at Gothenburg, NE / Page 11
12 MONSANTO the LEARNING CENTER Drought Mayhem: Corn and Soybean 2012 Drought Year Results 140 Average Yield bu/acre Low Input Agronomics Weed Control Genetics Insect Traits Drought Tolerant Biotech Trait Drought conditions during the 2012 demonstration provided a good example of the importance of implementing proper agronomic practices, compared to poorly managed plots. Soybean Treatments The same soybean product was planted in all plots at 160,000 plants/acre. Timely weed control and better genetics helped maintain water availability to crops and protect yield potential. Standard dryland fertility practices were used across all plots. Treatment Planting Date Row Spacing Tillage PRE Weed Control POST Weed Control Everything Wrong May inch Conventional None Roundup PowerMAX at R1 soybean Weed Control May inch Conventional Page 12 / 2014 Demo Report Tillage May inch No-till Planting Date May inch No-till POST Residual Herbicide Row Spacing May 15 May inch No-till 30-inch twin rows No-till Roundup PowerMAX + Authority MTZ Roundup PowerMAX + Authority MTZ Roundup PowerMAX + Authority MTZ Roundup PowerMAX + Authority MTZ Roundup PowerMAX + Authority MTZ Roundup PowerMAX + Select Max at 4 inch weeds Roundup PowerMAX + Select Max at 4 inch weeds Roundup PowerMAX + Select Max at 4 inch weeds Roundup PowerMAX + Select Max + Warrant Herbicide at 4 inch weeds Roundup PowerMAX + Select Max + Warrant Herbicide at 4 inch weeds
13 Drought Mayhem: Corn and Soybean Key Messages The high level of stress management and the Drought Tolerant Biotech Trait treatment produced the highest corn yield, approximately 25 bu/acre more than other treatments. This was likely due to the Genuity DroughtGard Hybrids with VT Double PRO RIB Complete corn blend product allowing the corn plants to cope with the dry conditions recorded at the Learning Center where only 0.5 inch of rain fell in July. Early planting and good weed control were the most influential treatments in soybeans. The lowest yield in the corn and soybean studies was the Everything Wrong treatment, primarily due to poor weed control. The proper integration of improved corn genetics and biotech traits, with the implementation of the right agronomic practices can help manage drought and other risks. Legal Statements The information discussed in this report is from a single site, 5 replication research or demonstration trial. This informational piece is designed to report the results of this demonstration and is not intended to infer any confirmed trends. Please use this information accordingly. Monsanto Company is a member of Excellence Through Stewardship (ETS). Monsanto products are commercialized in accordance with ETS Product Launch Stewardship Guidance, and in compliance with Monsanto s Policy for Commercialization of Biotechnology- Derived Plant Products in Commodity Crops. Commercialized products have been approved for import into key export markets with functioning regulatory systems. Any crop or material produced from this product can only be exported to, or used, processed or sold in countries where all necessary regulatory approvals have been granted. It is a violation of national and international law to move material containing biotech traits across boundaries into nations where import is not permitted. Growers should talk to their grain handler or product purchaser to confirm their buying position for this product. B.t. products may not yet be registered in all states. Check with your Monsanto representative for the registration status in your state. IMPORTANT IRM INFORMATION: Genuity RIB Complete corn blend products do not require the planting of a structured refuge except in the Cotton-Growing Area where corn earworm is a significant pest. See the IRM/Grower Guide for additional information. Always read and follow IRM requirements. Individual results may vary, and performance may vary from location to location and from year to year. This result may not be an indicator of results you may obtain as local growing, soil and weather conditions may vary. Growers should evaluate data from multiple locations and years whenever possible. ALWAYS READ AND FOLLOW PESTICIDE LABEL DIRECTIONS. Some of the products discussed herein may be restricted use pesticides. Roundup Ready crops contain genes that confer tolerance to glyphosate, the active ingredient in Roundup brand agricultural herbicides. Roundup brand agricultural herbicides will kill crops that are not tolerant to glyphosate. Roundup Technology includes Monsanto's glyphosate-based herbicide technologies. Harness Herbicide are not registered in all states. Harness and Warrant Herbicide may be subject to use restrictions in some states. The distribution, sale, or use of an unregistered pesticide is a violation of federal and/or state law and is strictly prohibited. Check with your local Monsanto dealer or representative for the product registration status in your state. Tank mixtures: The applicable labeling for each product must be in the possession of the user at the time of application. Follow applicable use instructions, including application rates, precautions and restrictions of each product used in the tank mixture. Monsanto has not tested all tank mix product formulations for compatibility or performance other than specifically listed by brand name. Always predetermine the compatibility of tank mixtures by mixing small proportional quantities in advance DroughtGard, Genuity, Harness, RIB Complete, Roundup PowerMAX, Roundup Ready 2 Technology and Design, Roundup Ready, Roundup, Roundup Technology, VT Double PRO, VT Triple PRO and Warrant are trademarks of Monsanto Technology LLC. Leaf Design is a registered trademark of Monsanto Company. Authority is a trademark of FMC Corporation. Select Max is a registered trademark of Valent U.S.A. Respect the Refuge and Corn Design and Respect the Refuge are registered trademarks of National Corn Growers Association. All other trademarks are the property of their respective owners Monsanto Company JSC. Monsanto Learning Center at Gothenburg, NE / Page 13
14 MONSANTO Background the LEARNING CENTER Optimal plant density, corn product, and moisture availability are among several factors that can impact corn yield potential. Previous studies at the Monsanto Learning Center at Gothenburg have looked at the effect of different irrigation levels on the yield of corn planted at a constant planting density. Results have shown that: In 2010, some corn products yielded the highest at the 50% ET, while others responded to the 100% ET irrigation level. In 2011, the 100% ET irrigation level provided maximum yield when averaged across products and there was a difference in corn product response to different levels of irrigation. In 2013, corn products responded positively to a planting density increase from 24,000 to 30,000 seeds/acre across all irrigation levels. Results from Kansas State University research on subsurface drip irrigation (SDI) system showed: 1 Irrigation capacity of 0.17 inches/day was sufficient for corn planted on deep silt loam soils. Increasing plant population from 22,500 to 34,500 seeds/acre increased corn grain yield. Increasing plant population thereafter had little effect on corn yield. Study Guidelines A corn demonstration trial, with three replications, was conducted at the Monsanto Learning Center at Gothenburg, NE, to provide information to corn farmers about seeding rates that should be considered in different irrigation environments. It was also used to determine the response of different corn products to seeding rate under different irrigation regimes. Variable Rate Irrigation - Density by Irrigation Treatments Three corn products with relative maturities (RM) of 112, 113, and 114 days planted April 24, Five seeding rates of 18,000; 22,000; 26,000; 30,000; and 34,000 seeds/acre. Three irrigation regimes, each represents the percentage of the full irrigation amount: 50% (3.0 inches) 70% (4.2 inches) 100% (6.0 inches) The demonstration trial was planted into no-till wheat stubble. There were no foliar fungicide or insecticide applications made. Weeds were controlled uniformly using a residual pre- and post- herbicide programs. Corn plants were harvested November 3, 2014 and yield was recorded. Results There was no interaction between irrigation, seeding rate, and corn product. Data were combined across corn products because: There was a significant interaction between irrigation regime and seeding rate (Figure 1). There was a significant interaction between seeding rate and corn product (data not shown). Key Messages Yield increased significantly as seeding rate increased from 18,000 to 22,000 seeds/acre across all irrigation treatments. At the 100% irrigation treatment, yield increased steadily with an increase in seeding rate. At 70% irrigation treatment, yield increased as seeding rate increased to 30,000 seeds per/acre but leveled off thereafter. Page 14 / 2014 Demo Report
15 Variable Rate Irrigation - Density by Irrigation At 50% irrigation, yield was similar when seeding rate increased from 22,000 to 30,000 seeds/acre, but surprisingly, increased at 34,000 seeds/acre. No yield penalty for increasing plant population across different irrigation environments: Similar University research showed very little penalty for increasing plant population when irrigation was limited or eliminated under SDI system. 1 Source 1 Lamm, F.R. and Trooien, TP Irrigation capacity and plant population effects on corn production using SDI. Kansas State University. Legal Statement The information discussed in this report is from a single site, replicated research or demonstration trial. This informational piece is designed to report the results of this demonstration and is not intended to infer any confirmed trends. Please use this information accordingly. ALWAYS READ AND FOLLOW PESTICIDE LABEL DIRECTIONS. Leaf Design is a registered trademark of Monsanto Company. All other trademarks are the property of their respective owners Monsanto Company SMK Average Yield (bu/acre) ,000 22,000 26,000 30,000 34,000 Seeding Rate (seeds/acre) 50% 70% 100% Figure 1. Effect of irrigation and seeding rates on average yield of three corn products. Monsanto Learning Center at Gothenburg, NE / Page 15
16 MONSANTO Background the LEARNING CENTER Many regions in the western Great Plains pump water from the Ogallala Aquifer to irrigate their crops. As supplies from this aquifer decline, these regions have seen reduced pumping capacities and restrictions on the amount of water farmers can use in a given year. Farmers in this region are looking for solutions to maintain crop yields with diminishing irrigation resources. Trials were conducted across the High Plains (eastern Colorado, western Kansas, central Nebraska, and the Panhandle of Texas) to assess the response of current and pre-commercial Monsanto corn products to varying irrigation rates and to determine how plant health is affected by different irrigation rates. These results will be used to assist with product recommendations based on a farmer s irrigation capacity. This report is a summary of the eastern Colorado and western Kansas data. Study Guidelines The trials were oriented along the curve of the pivot to avoid water pattern issues and to match the different controllable zones under the variable rate irrigation pivot. The trials were not replicated at each site but the plots were large. Plot lengths ranged from 250 feet long closest to the pivot center up to 700 feet furthest away from the pivot point. All plots Corn Product by Water Performance on the Irrigated High Plains were strip-tilled in the spring. Additional cultural practices are outlined by location below: Planting dates: Colorado: April 24, 2014 Kansas: May 1, 2014 Harvest dates: Colorado: October 21 and November 2, 2014 Kansas: October 14, 2014 Crop rotation: Colorado: corn/soybean Kansas: corn/sunflower Treatments Over 50 corn products ranging from relative maturity (RM) were tested with three irrigation treatments: Full Irrigation (FI): 100% evapotranspiration (ET) replacement planted at 34,000 seeds/acre 70% of FI planted at 29,000 seeds/acre 50% of FI planted at 24,000 seeds/acre Treatment Irrigation (inches) Rainfall (inches) Total (inches) Seeding Rate Full Irrigation (FI) ,000 70% FI ,000 50% FI ,000 Figure 1. Summary of irrigation treatments, precipitation, and seeding rate. Page 16 / 2014 Demo Report
17 Corn Product by Water Performance on the Irrigated High Plains Precipitation and ET Trends Average rainfall between the two sites was 13 inches; 10 inches of that came before July 15th, so there was little rainfall at tassel and the early reproductive stages (Figure 2). The 30-year average rainfall was 11.5 inches, so the plots received approximately 1.5 inches more water in 2014 than in an average year, which helped to promote higher yields in the limited irrigation treatments. Results The results from the 110 RM products are presented in this report and are representative of the results from the other RM groups. In general, the highest yields were attained in the full irrigation treatment and yields decreased in the 70 and 50% treatments (Figure 3). The degree to which yield was reduced in the 70 and 50% treatments varied among products. Some products, such as product C, were high performers in the full irrigation treatment but weren t as consistent in the lower irrigation rates. Other products, such as product H, maintained consistent yields across the irrigation regimes. Late-season plant health was compromised in some products with the low irrigation treatments resulting in greater amounts of lodging and lower yields (Figure 4). Note: Three hail events early in the season severely stripped leaf material during early vegetative growth; this limited full yield potential in all trials. Yield per thousand (YPT) is a measure of the yield per thousand plants. This measurement can be used as a tool to optimize the yield potential of a field by determining optimal plant population based on the inputs available to support plant health, such as water and fertility. In this study, YPT was greatest at the lowest planting rate and irrigation treatment (Figure 5); however, overall yields were the greatest at the highest planting rate/full irrigation treatment. Irrigation & Precipitation in 2014 & 30-Year Average Precipitation 25 Rainfall & Irrigation (inches) V8 VT 5 0 5/12 5/17 5/22 5/27 6/1 6/6 6/11 6/16 6/21 6/26 7/1 7/6 7/11 7/16 7/21 7/26 7/31 8/5 8/10 8/15 8/20 8/25 8/30 9/4 9/9 9/14 9/19 9/24 9/29 10/4 R3 R5 100% Irrigation 70% Irrigation 50% Irrigation 2014 Rainfall 30 Year Historic Rainfall Figure 2. Total amounts of water received from irrigation and precipitation in the three treatments, precipitation in 2014, and 30-year average precipitation. Amounts shown are averaged across the Colorado and Kansas sites. Monsanto Learning Center at Gothenburg, NE / Page 17
18 MONSANTO the LEARNING CENTER Corn Product by Water Performance on the Irrigated High Plains RM Product Performance Grain Yield (bu/acre) Page 18 / 2014 Demo Report A B C D E F G H I Corn Product 50% Irrigation 70% Irrigation 100% Irrigation Figure 3. Yields of the 110 RM products under different irrigation treatments. % of Stalks Lodged When Pushed to a 30 Degree Angle RM Product Stalk Strength A B C D E F G H I Corn Product 50% Irrigation 70% Irrigation 100% Irrigation Figure 4. Push test results from the 110 RM products.
19 Corn Product by Water Performance on the Irrigated High Plains Yield per Thousand Plants bu/thousand Plants A B C D E F G H I Corn Product 50% Irrigation 70% Irrigation 100% Irrigation Figure 5. Yield per thousand plants for the 110 RM products. Key Messages By testing products under varying rates of irrigation across the Great Plains, Monsanto is better able to help farmers place products by field based on their irrigation capacity, as well as other attributes such as disease tolerance or agronomic packages. With declining groundwater resources in the Great Plains region, this work is just the beginning of helping farmers maximize the return per inch of irrigation and helping to extend the useful life of the Ogallala Aquifer. Legal Statements The information discussed in this report is from a non-replicated research or demonstration trial. This informational piece is designed to report the results of this demonstration and is not intended to infer any confirmed trends. Please use this information accordingly. Individual results may vary, and performance may vary from location to location and from year to year. This result may not be an indicator of results you may obtain as local growing, soil and weather conditions may vary. Growers should evaluate data from multiple locations and years whenever possible. Leaf Design is a registered trademark of Monsanto Company Monsanto Company CAM Monsanto Learning Center at Gothenburg, NE / Page 19
20 MONSANTO Background the LEARNING CENTER Due to declining groundwater levels in the Ogallala Aquifer, the primary source of irrigation water for much of the Great Plains, farmers in this region are facing reduced pumping capacities and restrictions on the amount of water they are allowed to pump in a season. When the available water is not enough to meet crop demands throughout the growing season, it becomes critical to know when is the most effective time in the crop s life cycle to apply irrigation to maximize yield potential and profits. This study was designed to demonstrate the importance of irrigation timing on corn yield potential. Research has shown that grain yield losses related to water stress are greatest when stress occurs during the early reproductive stages, tasseling (VT) through milk stage (R3), while water stress after the dough stage (R4) has less of an impact. 1,2,3 One study showed that a single irrigation omission during the tasselling and ear formation growth stages could cause a 30 to 40% grain yield loss during a dry year. Much greater losses during a dry year of 66 to 93% could be expected as a result of prolonged water stress during these sensitive growth stages. 3 Study Guidelines Nine corn products with relative maturities (RM) ranging from RM were planted on May 8, The field was planted to soybeans the previous season. Spring strip-till and season-long weed control was conducted in all plots. All corn products contained insect protection traits. Corn Response to Timing of Water Application Treatments Water was applied through a drip irrigation system with the following treatments: No irrigation (dryland control) 3 inches applied before V16 (early) 3 inches applied at VT (appropriate timing) 3 inches applied at R3 (late) Each treatment was replicated 3 times. Results Precipitation and Soil Moisture During the 2014 growing season, precipitation was adequate during the vegetative growth stages resulting in limited stress, but precipitation was inadequate during the reproductive growth stages (VT-R3) resulting in moisture stress. Precipitation, irrigation, and soil moisture was recorded for each treatment: Dryland (Figure 1). Soil moisture reached the Maximum Allowable Depletion (MAD) level at the V16 growth stage, indicating moisture stress throughout most of the reproductive stages. 3 inches before V16 (Figure 2). Applying irrigation prior to the V16 growth stage resulted in less moisture stress early in the reproductive stages as compared to the dryland control, but it still allowed soil moisture to drop below the MAD level just after the VT growth stage. 3 inches at VT (Figure 3). Applying 3 inches of water at the VT growth stage allowed soil moisture to very closely mirror the MAD level and provided the least amount of stress in the early reproductive growth stages. 3 inches at R3 (Figure 4). In this treatment, soil moisture remained below the MAD level during the early reproductive stages causing moisture stress during these critical periods. Page 20 / 2014 Demo Report
21 Corn Response to Timing of Water Application Dryland V16 VT R3 Water in Inches Irrigation Total Effective Accumulated Rain Water Storage at Field Capacity Permanent Wilting Point Maximum Allowable Depletion Calculated Soil Water Content 0 Figure 1. Water chart for the dryland control Inches Before V16 V16 VT R3 12 Water in Inches Irrigation Effective Accumulated Rain Water Storage at Capacity Permanent Wilting Point Maximum Allowable Depletion Calculated Soil Water Content 2 0 Figure 2. Water chart for the 3 inches before V16 treatment. Monsanto Learning Center at Gothenburg, NE / Page 21
22 MONSANTO the LEARNING CENTER Corn Response to Timing of Water Application 3 Inches at VT 16 V16 VT R Water in Inches Irrigation Effective Accumulated Rain Water Storage at Field Capacity Permanent Wilting Point Maximum Allowable Depletion Calculated Soil Water Content 2 0 Figure 3. Water chart for the 3 inches at VT treatment Inches at R3 V16 VT R3 14 Water in Inches Irrigation Effective Accumulated Rain Water Storage at Capacity Permanent Wilting Point Maximum Allowable Depletion Calculated Soil Water Content 0 Figure 4. Water chart for the 3 inches at R3 treatment. Page 22 / 2014 Demo Report
23 Corn Response to Timing of Water Application Results Yields The dryland control received the greatest amount of water stress during the reproductive growth stages and resulted in the lowest yields (Figure 5). Applying 3 inches of water at the VT growth stage resulted in minimal water stress and the highest average yields in the study. Applying 3 inches of water at the R3 growth stage provided the lowest yield benefit of the irrigation treatments. Corn yield in this treatment did benefit from the 3 inches of water compared to the dryland control. These results show the impact that irrigation timing can have on yield. A return of as much as 19 bushels per acre over the dryland yields can be achieved with each inch of water when applied at the VT growth stage (Figure 6). In terms of profit, based on a market value of corn of $3.50 per bushel, this study showed that a return of as much as $67.20 per acre can be possible with each inch of water when applied at the VT growth stage (Figure 7). This is not net return, which can be determined by subtracting irrigation costs from yield profits. Yield (bu/acre) Key Messages This research reiterated the results of previous research and showed that corn yield loss related to water stress can be greatest when induced in the early reproductive growth stages. This study showed that a small amount of water at the critical timeframe can have a substantial impact on corn yields. A return in yields of as much as 14 bushels per acre per inch of evapotranspiration have been reported for corn. 4 This study showed that, when applied at the critical timeframe, each inch of water could result in a yield increase of as much as 19 bushels per acre. Sources: 1 Payero, J.O., Tarkalson, D., Irmak, S., Davison, D., and Petersen, J.L Effect of timing of a deficit-irrigation allocation on corn evapotranspiration, yield, water use efficiency and dry mass. Agricultural Water Management vol 96: Results from the rainout shelter Gothenburg Learning Center Summary. Technology Development & Agronomy EJP. 3 Cakir, R Effect of water stress at different developmental stages on vegetative and reproductive growth of corn. Field Crops Research vol 89: Sadras, V.O., Grassini, P., and Steduto, P. Status of water use efficiency of main crops. SOLAW background thematic report-tr07. FAO. Dryland 3 in. before V16 3 in. at V T 3 in. at R3 Figure 5. Yields by irrigation treatment. Legal Statements The information discussed in this report is from a single site, replicated research or demonstration trial. This informational piece is designed to report the results of this demonstration and is not intended to infer any confirmed trends. Please use this information accordingly. Yields by Irrigation Treatment 208 Irrigation Treatment LSD (0.10) 15.0 Individual results may vary, and performance may vary from location to location and from year to year. This result may not be an indicator of results you may obtain as local growing, soil and weather conditions may vary. Growers should evaluate data from multiple locations and years whenever possible. Leaf Design is a registered trademark of Monsanto Company Monsanto Company CAM Monsanto Learning Center at Gothenburg, NE / Page
24 MONSANTO the LEARNING CENTER Corn Response to Timing of Water Application Return (bu/acre) per Inch Water Applied Return in Yields per Inch of Water as Influenced by Application Timing 15.9 Dryland 3 in. before V16 3 in. at VT 3 in. at R3 Irrigation Treatment Figure 6. Return in yields per inch of water over the dryland control. Return ($/acre) per Inch Water Applied $80 $70 $60 $50 $40 $30 $20 $10 $0 Page 24 / 2014 Demo Report Return in Dollars per Inch of Water as Influenced by Application Timing Dryland 3 in. before V16 3 in. at VT 3 in. at R3 Figure 7. Return in dollars per inch of water over the dryland control. Irrigation Treatment

 regulate soil temperature and, 2) reduce soil water loss.")
25 Effect of Residue Removal on Irrigated Corn Yields In many areas, the residue from corn production is removed by grazing or baling (Figures 1 and 2). With the residue being removed, an important question is: How does residue removal affect the yield potential of future corn crops? Crop residues help reduce soil erosion when left on the soil surface and are important contributors to overall soil health through the return of organic matter and nutrients to the soil. In addition, residues help to: 1) regulate soil temperature and, 2) reduce soil water loss. Several studies have been conducted by universities to help determine the affects of residue removal on yield potential. Yield studies conducted by the University of Nebraska on irrigated acreage showed no decrease in corn yield due to grazing 1. Other studies have shown that mechanical residue removal can have a negative affect on yield potential. 2,3,4 One study determined that 80 to 90% of the total residue effect on grain production was attributable to the conservation of soil water. 2 A Bushland, Texas study showed that soils with 7,000 to 10,000 lbs/acre of wheat residue during fallow had an average of 3.2 to 3.6 inches more soil water stored compared to bare soil at planting. 5 Figure 1. Cattle grazing on residue. Figure 2. Windrowing stalks for baling. Study Guidelines A corn research study was established at the Monsanto Learning Center near Gothenburg, NE to help determine the effects of residue removal on irrigated corn yield potential. Five Genuity SmartStax RIB Complete Corn Blend products were selected for the trial with relative maturities (RM) of 109, 110, 112, 113, and 115. A continuous corn rotation field was selected for the study. A no-till planting method with precision planting capabilities was used and weeds were controlled using residual/post emergence weed control programs. Treatments Residue baled after harvest. Residue grazed by cattle at 1.5 AUM/acre (Animal Unit Month or amount of forage consumed by a 1,000 lb animal/acre/month). No residue removed. Irrigation and Rainfall Events Irrigation scheduled using WATERMARK soil moisture sensors placed in Rep 1 of the no residue removed treatment. Five inches of irrigation water were applied during the growing season. Fifteen inches of rainfall were received from May through September. Grazing and Baling Treatments Individual grazing blocks were fenced and the appropriate cattle numbers were allowed to graze for a 24-hour period to equal a stocking rate of 1.5 AUM/acre. Individual baling blocks were cut and windrowed with a rotary disk mower and baled into large round bales. Five replications of each treatment. Soil Compaction Measurement Compaction measured with penetrometers after the removal operations and before spring planting operation. Used to indicate root growth and water movement in the soil. Monsanto Learning Center at Gothenburg, NE / Page 25
26 MONSANTO the LEARNING CENTER Results and Key Messages Yield of individual products and overall average yield of all products was highest when no residue was removed (Figures 3 and 4). With the exception of the 109 RM product, there was a statistical difference among the treatments at the 0.1 level of significance when the no residue removal and grazed treatments were compared (Figure 3). With the exception of the 109 RM product, there was a statistical difference among the treatments at the 0.1 level of significance when the no residue removal and baled treatments were compared (Figure 3). Effect of Residue Removal on Irrigated Corn Yields All products may have flowered prior to the stress of a very dry pollination period for the baled and grazed treatments as indicated on the soil moisture graph (Figure 6). Soil moisture levels became very dry for the baling and grazing removal treatments near pollination; likely due to early-season growth compared to the no removal treatment (Figure 5). With the exception of the 113 RM product, there was no statistical difference among the treatments at the 0.1 level of significance when the baled and grazing removal treatments were compared (Figure 3). Grazed Baled No Removal LSD (0.1) = 7.7 Yield (bu/acre) A (110 RM) B (113 RM) Figure 3. Average yield of each product and treatment. C (112 RM) Product and Relative Maturity D (109 RM) E (115 RM) Page 26 / 2014 Demo Report

27 Effect of Residue Removal on Irrigated Corn Yields 180 Yield (bu/acre) Grazed Baled No Removal Figure 4. Average yield of all products for each treatment Treatment Residue Removed No Residue Removed Figure 5. Rapid corn growth where residue was removed compared to slow growth where residue was not removed. Monsanto Learning Center at Gothenburg, NE / Page 27
28 MONSANTO the LEARNING CENTER Effect of Residue Removal on Irrigated Corn Yields 250 Baled 3' Grazed 3' No Removal 3' Field Capacity 50% Plant Available Water VT Stage R3 Stage 200 Soil Moisture Sensors (cbar) /27/14 12:00 AM 7/4/14 12:00 AM 7/11/14 12:00 AM Figure 6. Soil moisture at three feet. 7/18/14 12:00 AM 7/25/14 12:00 AM 8/1/14 12:00 AM 8/8/14 12:00 AM 8/15/14 12:00 AM 8/22/14 12:00 AM Date and Time 8/29/14 12:00 AM 9/5/14 12:00 AM 9/12/14 12:00 AM 9/19/14 12:00 AM 9/26/14 12:00 AM 10/3/14 12:00 AM Additional irrigation (fully irrigated) at pollination would have likely produced similar yields for the grazing treatment compared to the no removal treatment, since soil moisture in the grazing treatment was in the acceptable range (between field capacity and 50% depletion of plant available water) for the remainder of the season. Under an allocated scenario, a few inches of water would have had to be applied at the critical growth stage for the baling and grazing treatments. This is water that under the no removal treatment could have been available during late grain fill to produce higher yields. A minimum of 7,000 lbs/acre of residue or more are needed to reduce soil moisture evaporation and increase stored soil moisture. 5 Fields with higher grain yields (> 170 bu/acre) would produce 8,700 to 10,780 lbs/acre of residue, which is sufficient to maximize soil moisture even after grazing (Table 1). 6 Table 1. Residue removed by baling and grazing. Treatment Residue lbs/acre Baled 5,200 Grazed 7,400 No Removal 12,200 Page 28 / 2014 Demo Report
29 Effect of Residue Removal on Irrigated Corn Yields Compaction from equipment and animal traffic is always a concern. Each trip across a field with heavy equipment has the potential to destroy soil structure. Animals grazing on a field, particularly if soil conditions are wet, have the potential to increase compaction at different depths. A penetrometer was used to measure resistance at various depths to determine the amount of compaction resulting from the treatments (Table 2). Results from the penetrometer measurements indicated that: Grazing and baling treatments had significantly higher readings compared to the no removal treatment at shallower depths. Compaction levels were well below the threshold of 300 psi for limiting root growth and water movement in the soil. Table 2. Compaction at various depths as measured by a penetrometer Depth (inches) and PSI Measurements Treatment Grazed 69 a* 127 a 142 a 141 a 138 b 132 b 129 b 148 a 151 ab 154 a 151 a Baled 73 a 128 a 180 a 172 a 179 a 182 a 181 a 180 a 179 a 173 a 166 a No Removal 26 b 42 b 73 b 93 b 111 b 127 b 133 b 128 a 128 b 137 a 141 a *Letters indicate level of significance at each sampling depth. Sources: 1 McGee, A.L., Klopfenstein, T.J., Stalker, L.A., and Erickson, G.E Effect of grazing corn residue on corn and soybean yields Nebraska Beef Cattle Report. MP98. University of Nebraska. 2 Wilhelm, W., Doran, J.W., and Power, J.F Corn and soybean yield response to crop residue management under no-tillage production systems. Agronomy Journal. Vol. 78: Wilhelm, W., Johnson, J.M.F., Hatfield, J.L., Voorhees, W.B., and Linden, D.R Crop and soil productivity response to corn residue removal: a literature review. Agronomy Journal. Vol. 96: Van Donk, S.J. and Klocke, N.L Tillage and crop residue removal effects on evaporation, irrigation requirements, and yield. Proceedings of the 2012 CPIC. Colby, Kansas. 5 Unger, P.W Straw-mulch rate effect on soil water storage and sorghum yield. Soil Science Society of America Journal. Vol. 42(3): Musgrave, J.A., Gigax, J.A., Stalker, L.A., Klopfenstein, T.J., Stockton, M.C., Jenkins, K.H Effect of corn hybrid on amount of residue available for grazing. Pgs Nebraska Beef Cattle Report. University of Nebraska. (web sources verified 12/4/14). Legal The information discussed in this report is from a single site, replicated demonstration. This informational piece is designed to report the results of this demonstration and is not intended to infer any confirmed trends. Please use this information accordingly. Monsanto Company is a member of Excellence Through Stewardship (ETS). Monsanto products are commercialized in accordance with ETS Product Launch Stewardship Guidance, and in compliance with Monsanto s Policy for Commercialization of Biotechnology- Derived Plant Products in Commodity Crops. Commercialized products have been approved for import into key export markets with functioning regulatory systems. Any crop or material produced from this product can only be exported to, or used, processed or sold in countries where all necessary regulatory approvals have been granted. It is a violation of national and international law to move material containing biotech traits across boundaries into nations where import is not permitted. Growers should talk to their grain handler or product purchaser to confirm their buying position for this product. B.t. products may not yet be registered in all states. Check with your Monsanto representative for the registration status in your state. IMPORTANT IRM INFORMATION: Genuity RIB Complete corn blend products do not require the planting of a structured refuge except in the Cotton-Growing Area where corn earworm is a significant pest. See the IRM/Grower Guide for additional information. Always read and follow IRM requirements. Individual results may vary, and performance may vary from location to location and from year to year. This result may not be an indicator of results you may obtain as local growing, soil and weather conditions may vary. Growers should evaluate data from multiple locations and years whenever possible. ALWAYS READ AND FOLLOW PESTICIDE LABEL DIRECTIONS. Roundup Ready crops contain genes that confer tolerance to glyphosate, the active ingredient in Roundup brand agricultural herbicides. Roundup brand agricultural herbicides will kill crops that are not tolerant to glyphosate. Genuity, RIB Complete, Roundup Ready 2 Technology and Design, Roundup Ready, Roundup and SmartStax are trademarks of Monsanto Technology LLC. Leaf Design is a registered trademark of Monsanto Company. LibertyLink and the Water Droplet Design is a registered trademark of Bayer. Herculex is a registered trademark of Dow AgroSciences LLC. Respect the Refuge and Corn Design and Respect the Refuge are registered trademarks of National Corn Growers Association. All other trademarks are the property of their respective owners Monsanto Company LGM Monsanto Learning Center at Gothenburg, NE / Page 29
 emerges very early in the spring (the majority emerging in March) and farmers need to develop a long-term plan to manage kochia during all phases of the cropping system before this weed")
30 MONSANTO Introduction the LEARNING CENTER Kochia (Kochia scoparia L. Schrad) emerges very early in the spring (the majority emerging in March) and farmers need to develop a long-term plan to manage kochia during all phases of the cropping system before this weed begins rapid vegetative growth. 1 A glyphosate-resistant biotype of kochia has either been confirmed, or is likely, in many of the Great Plains States. 1 Farmers currently use fall or early spring-applied residual herbicides to control kochia. However, sometimes weather conditions do not allow early spring applications and farmers miss opportunities to control the weed before it emerges. Due to the risk of adverse weather conditions that can sometimes prevent an early spring residual application, a fall residual application should be considered in conjunction with fall burndown. The objective of this study is to determine if late fall applications of residual herbicide combinations are as effective as early spring applications for the control of kochia. Fall and Early Spring Options to Control Kochia Materials and Methods Relative kochia populations: Colby, Kansas and Tribune, Kansas had heavy kochia infestations of 100+ plants/m 2. Hays, Kansas had a light kochia infestation of 5 plants/plot (plot dimension 10 x 30 feet). Herbicides were applied in the fall and spring at the sites: Colby, KS = November 13, 2013 and March 14, 2014 Tribune, KS = November 20, 2013 and March 15, 2014 Hays, KS = November 18, 2013 and March 6, 2014 Key Messages Similar control was observed for kochia from fall-applied or early spring-applied residual herbicide treatments. Excellent control of kochia was observed at Tribune and Hays, KS across all herbicide combinations. At Colby, treatment differences were apparent. The 0.5 lb ae/a of Clarity (dicamba) applied in the fall consistently increased control of kochia by 20% or greater when added to other residual herbicide combinations. Residual herbicide combinations with multiple modes of action consistently provided better control than 1 lb ai/a of atrazine or Sencor 75D applied alone. Check all herbicide labels for the correct application rates and local restrictions before using these products. Fallapplied residuals are not a replacement for residuals applied preemergence or at planting. Figure 1. Kochia seedlings emerging in early spring. Page 30 / 2014 Demo Report
31 Fall and Early Spring Options to Control Kochia Table 1. Effect of Spring- and Fall -applied Herbicides on Kochia Control at Corn Planting. Treatment Rate Rate Unit Appl. Timing Kochia Control at Corn Planting % Name Rate Unit Code Colby Tribune Hays CLARITY 0.5 lb ae/a AUTHORITY MTZ lb ai/a CLARITY 0.5 lb ae/a AUTHORITY MTZ lb ai/a HARNESS XTRA 2.08 lb ai/a BALANCE FLEXX lb ai/a CLARITY 0.5 lb ae/a HARNESS XTRA 2.08 lb ai/a BALANCE FLEXX lb ai/a CLARITY 0.5 lb ae/a CLARITY 0.5 lb ae/a SENCOR 75DF 1 lb ai/a VALOR SX lb ai/a CLARITY 0.5 lb ae/a SENCOR 75DF 1 lb ai/a VALOR SX lb ai/a Untreated Check LSD (0.1) Spring Fall Spring Fall Spring Fall Monsanto Learning Center at Gothenburg, NE / Page 31
32 MONSANTO the LEARNING CENTER Fall and Early Spring Options to Control Kochia Percent Kochia Control Evaluation at 1 to 2 wks before Planting Evaluation At Planting Figure 2. Effect of Fall Herbicide Applications at a Site with High Kochia Pressure: Colby, KS Page 32 / 2014 Demo Report
; Fall-Applied")

33 Fall and Early Spring Options to Control Kochia Figure 3. Kochia Seedlings in Untreated Plot (Left); Fall-Applied atrazine + Clarity (Right). Photo taken 1 to 2 weeks before planting. Monsanto Learning Center at Gothenburg, NE / Page 33
34 MONSANTO the LEARNING CENTER Fall and Early Spring Options to Control Kochia Treatment Rate Rate Unit Appl. % Kochia Control 1 to 2 Timing weeks Before Planting % Kochia Control at Corn Planting Name Rate Unit Code Colby Tribune Colby Tribune Hays ATRAZINE 1 lb ai/a Fall 68 -* CLARITY 0.5 lb ae/a SENCOR 75DF 1 lb ai/a Fall VALOR SX lb ai/a CLARITY 0.5 lb ae/a ATRAZINE 1 lb ai/a Fall CLARITY 5 lb ae/a SENCOR 75DF 1 lb ai/a Fall ZIDUA lb ai/a CLARITY 5 lb ae/a Fall SENCOR 75DF 1 lb ai/a HARNESS XTRA 2.08 lb ai/a CLARITY 0.5 lb ae/a Fall HARNESS XTRA 2.08 lb ai/a BALANCE FLEXX lb ai/a Fall CLARITY 0.5 lb ae/a SENCOR 75DF 1 lb ai/a Fall CLARITY 0.5 lb ae/a SENCOR 75DF 1 lb ai/a SHARPEN lb ai/a CLARITY 0.5 lb ae/a AUTHORITY MTZ lb ai/a HARNESS XTRA 2.08 lb ai/a BALANCE FLEXX lb ai/a ATRAZINE 1 lb ai/a BALANCE FLEXX lb ai/a SENCOR 75DF 1 lb ai/a VALOR SX lb ai/a - indicates not treated at this site - indicates not treated at this site Fall Fall Fall Fall Fall Page 34 / 2014 Demo Report
35 Fall and Early Spring Options to Control Kochia Treatment Rate Rate Unit Appl. Timing % Kochia Control 1 to 2 weeks Before Planting % Kochia Control at Corn Planting CLARITY 0.5 lb ae/a LINEX 1 lb ai/a Fall HARNESS XTRA 2.08 lb ai/a BALANCE FLEXX lb ai/a Spring CLARITY 0.5 lb ae/a CLARITY 0.5 lb ae/a HARNESS XTRA 3.48 lb ai/a Spring CLARITY 0.5 lb ae/a SENCOR 75DF 1 lb ai/a Spring VALOR SX lb ai/a CLARITY 0.5 lb ae/a VALOR SX lb ai/a Spring CLARITY 0.5 lb ae/a AUTHORITY MTZ lb ai/a Spring Untreated Check LSD (0.1) indicates not treated at this site Sources 1 Resistance Kochia Management. RRPLUS, Technology Development and Agronomy Legal The information discussed in this report is from a multiple site, single year, non-replicated demonstration. This informational piece is designed to report the results of this demonstration and is not intended to infer any confirmed trends. Please use this information accordingly. Individual results may vary, and performance may vary from location to location and from year to year. This result may not be an indicator of results you may obtain as local growing, soil and weather conditions may vary. Growers should evaluate data from multiple locations and years whenever possible. ALWAYS READ AND FOLLOW PESTICIDE LABEL DIRECTIONS. Harness is a restricted use pesticide and is not registered in all states. The distribution, sale, or use of an unregistered pesticide is a violation of federal and/or state law and is strictly prohibited. Check with your local Monsanto dealer or representative for the product registration status in your state. Tank mixtures: The applicable labeling for each product must be in the possession of the user at the time of application. Follow applicable use instructions, including application rates, precautions and restrictions of each product used in the tank mixture. Monsanto has not tested all tank mix product formulations for compatibility or performance other than specifically listed by brand name. Always predetermine the compatibility of tank mixtures by mixing small proportional quantities in advance. Harness is a registered trademark of Monsanto Technology LLC. Leaf Design is a registered trademark of Monsanto Company. Authority is a trademark of FMC Corporation. Valor is a registered trademark of Valent U.S.A. Corporation. All other trademarks are the property of their respective owners Monsanto Company SEK Monsanto Learning Center at Gothenburg, NE / Page 35
36 MONSANTO Background the LEARNING CENTER What are the important components of high-yield corn management? How much difference do management practices make in various environments? Is there an additive effect with each individual management practice contributing to yield potential? Study Guidelines A demonstration trial with three replications was conducted at the Monsanto Learning Center near Gothenburg, NE to address these questions by evaluating the effect of various inputs contributing to increasing yield potential in a continuous corn and corn after soybean environments. All plots were strip-tilled on April 24, 2014 with phosphorus (P) and nitrogen (N) applied pre-plant with the strip-till operation. The demonstration trial was planted on April 26, Weeds were controlled uniformly throughout the season using a residual PRE and POST herbicide program. Irrigation occurred from mid-july to mid-august. Treatments Two crop rotations: corn after corn; corn after soybeans. Corn products: Five products in the corn after corn rotation and six products in the corn after soybean rotation were planted. All corn products were Genuity SmartStax RIB Complete corn blend products. The basic treatment consisted of: 40 lbs/acre P as , applied pre-plant with strip-till. 250 lbs/acre N for corn after corn rotation; 200 lbs/ acre N for corn after soybean rotation; applied preplant as UAN liquid solution with strip-till. 30,000 seeds planted/acre. The basic treatment had overwater irrigation by 20% resulting in 6 inches total water/acre. Impact of Additive Management Practices on Corn Yield Potential Subsequent treatments included the previous treatment plus an additional treatment resulting in a building block approach of treatments. Treatment 1 - Basic management. Treatment 2 - plus 40 lbs P/acre applied pre-plant with strip-till. Treatment 3 - plus split N application injected as UAN liquid solution; 30 % applied pre-plant with strip-till and 70% applied side-dress. Corn after corn rotation had 75 lbs N/acre pre-plant and 175 lbs N/acre side-dress. Corn after soybean rotation had 60 lbs N/acre pre-plant and 140 lbs N/acre side-dress. Treatment 4 - plus increased seeding rate to 37,000 seeds/acre (+7,000 seeds/acre). Treatment 5 - plus fungicide application of 10 fl oz/acre of Headline AMP at tasseling growth stage (VT) on July 17. Treatment 6 - plus Sulfur at 24 lbs/acre and Zinc at 2.6 lbs/acre applied pre-plant with strip-till. Treatment 7 - plus correct irrigation amount; addition of 5 inches water/acre. Treatment 8 - plus late N application of 40 lbs N/acre of dry urea (46-0-0) dribbled between the rows followed by immediate irrigation. Application occurred at blister growth stage (R2) on August 1. Treatment 9 plus late K foliar application of 80 lbs/acre at R2 growth stage on July 29. A summary of the treatments for the corn after corn rotation are shown in Figure 1. Page 36 / 2014 Demo Report
37 Impact of Additive Management Practices on Corn Yield Potential: Results: Corn After Corn Rotation Figures 2 and 3 show the average yield by additive treatment (Figure 2) and cumulative treatment cost and economic gain versus the basic treatment (Figure 3) for the corn after corn rotation. Results: Corn After Soybean Rotation Figures 4 and 5 show the average yield by additive treatment (Figure 4) and cumulative treatment cost and economic gain versus the basic treatment (Figure 5) for the corn after soybean rotation. Treatment Management P N* (32-0-0) Density seeds/ acre Fungicide (Headline AMP) Sulfur and Zinc Water** Late N (46-0-0) dry urea Foliar K (0-0-28) 1 BM Basic Management Low 40 lbs/acre All Pre 30,000 No No Overwater + 20% (6 inches) No No 2 AP Add Phosphorus 80 lbs/acre All Pre 30,000 No No Overwater + 20% (6 inches) No No 3 SN Split Nitrogen 175 lbs June lbs/acre 30%/70% 30,000 No No Overwater + 20% (6 inches) No No 4 DE Increased Density 80 lbs/acre 30%/70% 37,000 No No Overwater + 20% (6 inches) No No 5 FU Fungicide 10 fl VT, July lbs/acre 30%/70% 37,000 Yes No Overwater + 20% (6 inches) No No 6 SZ 24lbs/acre, 2.6 lbs/acre, Appliedpre with strip-till 80 lbs/acre 30%/70% 37,000 Yes Yes Overwater + 20% (6 inches) No No 7 CW Correct Water 80 lbs/acre 30%/70% 37,000 Yes Yes Correct water (5 inches) No No 8 FN Late N application, 40 R2, August 1 80 lbs/acre 30%/70% 37,000 Yes Yes Correct water (5 inches) Yes No 9 FK Late K foliar application, 1 R2, July lbs/acre 30%/70% 37,000 Yes Yes Correct water (5 inches) Yes Yes Figure 1. Treatment summary for corn after corn rotation. *Corn after corn rotation had 250 lbs N/acre, while the corn after soybean rotation had 200 lbs N/acre. **All irrigation occurred from mid-july to mid-august. Monsanto Learning Center at Gothenburg, NE / Page 37
38 MONSANTO the LEARNING CENTER Impact of Additive Management Practices on Corn Yield Potential Corn After Corn Rotation 230 Yield (bu/acre) LSD (0.1) = bu/acre Figure 2. Average yield by additive treatment for the corn after corn rotation. *Hail events at R1 (July 10) and R4 (Aug 17) damaged leaf area leading to reduced yield potential. Page 38 / 2014 Demo Report
39 Impact of Additive Management Practices on Corn Yield Potential Corn After Corn Rotation Treatment Yield* (bu/acre) Treatment Cost ($/acre) Cumulative Treatment Costs ($/acre) Economic Gain vs Basic Treatment Basic Mgt 179 d Additional P 185 bcd $22.58 $22.58 $21.00 Split N Application 183 cd $10.00 $32.58 $14.00 Increased Density 199 abc $18.75 $51.33 $70.00 Fungicide 201 abc $29.00 $80.33 $77.00 Sulfur + Zinc 210 a $53.26 $ $ Correct Water 210 a - $5.00 $ $ Late Nitrogen 217 a $31.25 $ $ Late Foliar Potassium 204 ab $22.50 $ $87.50 Figure 3. Cumulative treatment cost and economic gain versus the basic treatment for the corn after corn rotation. *Hail events at R1 (July 10) and R4 (Aug 17) damaged leaf area leading to reduced yield potential. Key Points The general response to increased management resulted in a yield increase; however, not all eight treatments resulted in a yield increase. Considering all the treatments, increasing the seeding rate provided the most consistent yield increase in both rotations. The highest yield in the corn after soybean rotation was achieved after adding sulfur and zinc, while this treatment increased yield in the corn after corn rotation, the increase was not statistically significant. In general, the last three treatments (correct water amount, late N application at R2, late K foliar application at R2) were added at the end of the trial because they have been less consistent in increasing yield potential and provided mixed results in this trial. In the corn after corn rotation, there was no yield benefit to the late N application, while in the corn after soybean rotation, a yield reduction was observed. Monsanto Learning Center at Gothenburg, NE / Page 39
40 MONSANTO the LEARNING CENTER Impact of Additive Management Practices on Corn Yield Potential Corn After Soybean Rotation LSD (0.1) = 14.0 bu/acre Yield (bu/acre) Figure 4. Average yield by additive treatment for the corn after soybean rotation. *Hail events at R1 (July 10) and R4 (Aug 17) damaged leaf area leading to reduced yield potential. Page 40 / 2014 Demo Report
41 Impact of Additive Management Practices on Corn Yield Potential Corn After Soybean Rotation Treatment Yield* (bu/acre) Treatment Cost ($/acre) Cumulative Treatment Costs ($/acre) Economic Gain vs Basic Treatment Basic Mgt 223 c Additional P 225 c $22.58 $22.58 $7.00 Split N Application 222 c $10.00 $ $3.50 Increased Density 240 ab $18.75 $51.33 $59.50 Fungicide 243 ab $29.00 $80.33 $70.00 Sulfur + Zinc 248 a $53.26 $ $87.50 Correct Water 241 ab - $5.00 $ $63.00 Late Nitrogen 225 c $31.25 $ $7.00 Late Foliar Potassium 231 bc $22.50 $ $28.00 Figure 5. Cumulative treatment cost and economic gain versus the basic treatment for the corn after soybean rotation. *Hail events at R1 (July 10) and R4 (Aug 17) damaged leaf area leading to reduced yield potential. Source and Legals Below, F Management factors that contribute to high corn yields: Quantifying their value using an omission plot approach. University of Illinois. (verified 12/03/14). The information discussed in this report is from a single site, 3 replications research or demonstration trial. This informational piece is designed to report the results of this demonstration and is not intended to infer any confirmed trends. Please use this information accordingly. Monsanto Company is a member of Excellence Through Stewardship (ETS). Monsanto products are commercialized in accordance with ETS Product Launch Stewardship Guidance, and in compliance with Monsanto s Policy for Commercialization of Biotechnology- Derived Plant Products in Commodity Crops. Commercialized products have been approved for import into key export markets with functioning regulatory systems. Any crop or material produced from this product can only be exported to, or used, processed or sold in countries where all necessary regulatory approvals have been granted. It is a violation of national and international law to move material containing biotech traits across boundaries into nations where import is not permitted. Growers should talk to their grain handler or product purchaser to confirm their buying position for this product. B.t. products may not yet be registered in all states. Check with your Monsanto representative for the registration status in your state. IMPORTANT IRM INFORMATION: Genuity RIB Complete corn blend products do not require the planting of a structured refuge except in the Cotton-Growing Area where corn earworm is a significant pest. See the IRM/Grower Guide for additional information. Always read and follow IRM requirements. Individual results may vary, and performance may vary from location to location and from year to year. This result may not be an indicator of results you may obtain as local growing, soil and weather conditions may vary. Growers should evaluate data from multiple locations and years whenever possible. ALWAYS READ AND FOLLOW PESTICIDE LABEL DIRECTIONS. Roundup Ready crops contain genes that confer tolerance to glyphosate, the active ingredient in Roundup brand agricultural herbicides. Roundup brand agricultural herbicides will kill crops that are not tolerant to glyphosate. Genuity, RIB Complete, Roundup Ready 2 Technology and Design, Roundup Ready, Roundup and SmartStax are trademarks of Monsanto Technology LLC. Leaf Design is a registered trademark of Monsanto Company. LibertyLink and the Water Droplet Design is a registered trademark of Bayer. Herculex is a registered trademark of Dow AgroSciences LLC. Headline AMP is a registered trademark of BASF Corporation Monsanto Company DLB Monsanto Learning Center at Gothenburg, NE / Page 41
42 MONSANTO the LEARNING CENTER Irrigated Soybean Density Optimal soybean population density can increase soybean profitability, especially in fluctuating market conditions. Plant populations that are too high can limit nutrient availability by encouraging competition between plants. Populations that are too low are limited in yield potential due to loss in valuable land utility. Background For several years, the University of Nebraska has researched soybean plant populations to provide growers with recommendations for seeding rates. After 5 years of dependable data, the University of Nebraska recommends to plant 120,000 seeds/acre on 30-inch rows to maximize soybean profit potential. 1 However, in high-yielding environments, like those with irrigation, seeding rate recommendations are higher to take advantage of favorable conditions. Kansas State University recommends planting 160,000 seeds/acre in irrigated fields to achieve the highest yield potential. 2 Results from a 2010 study completed at the Monsanto Learning Center near Gothenburg, NE suggested a soybean planting rate of 125,000 seeds/acre to achieve the highest profitability. This recommendation was based on a $68.00 bag of seed containing 140,000 seeds and a soybean market price of $10.00/bu. This study also demonstrated the ability of soybean plants to compensate for potential yield loss through increased pod production at lower plant populations. Study Guidelines A soybean demonstration trial was conducted at the Monsanto Learning Center near Gothenburg, NE to continue to evaluate the response of different soybean population rates, and to determine the best irrigated seeding rate for flexibility in different soybean market conditions. Six different soybean seeding rates: 60,000, 100,000, 140,000, 180,000, 220,000, and 260,000 seeds/acre were no-till planted May 15, 2014 after wheat in 30-inch rows. Average Yield (bu/acre) Figure 1. Average soybean yield at six different plant populations. Page 42 / 2014 Demo Report LSD (0.1) = , , , , , ,000 Plant Population (seeds/acre)
43 Irrigated Soybean Density Table 1. Population and profitability in high and low soybean market conditions. Seed/acre Seed cost/ acre Bu/acre $/acre $10.40/bu Return less seed cost/acre $/acre $14.50/bu Return less seed cost/acre 60,000 $ $ $ $ $ ,000 $ $ $ $1, $ ,000 $ $ $ $1, $ ,000 $ $ $ $1, $ ,000 $ $ $ $1, $ ,000 $ $ $ $1, $ Irrigation was applied as needed, and weeds were uniformly controlled using residual and post-emergent weed control programs. The trial was designed as a small plot research trial with 4 replications. Potential profitability was also considered in this study by accounting for seed cost on a per acre basis. One $50.00 bag of seed contained 140,000 seeds, and both high, $14.50/bu, and low, $10.40/bu, soybean market prices were considered. Results and Discussion Average soybean yields increased as planting rate increased. When seeded at 100,000 seeds/acre, 5 more bu/acre were gained when compared to the lowest seeding rate of 60,000 seeds/acre. Average soybean yield gained another 5 bushel advantage when planted at the highest seeding rate of 260,000 seeds/acre (Figure 1). When seed cost and market prices of $10.40/bu and $14.50/bu, were considered, two different seeding rates were most profitable. With a lower soybean market price of $10.40, the highest profitability was achieved at a seeding rate of 100,000 seeds/acre. Conversely, a higher soybean market price of $14.50/bu provided the highest profitability at a seeding rate of 260,000 seeds/acre (Table 1). Potential profitability was greatly affected by market price in this study. An average gain of $ across all plant populations is attained with the higher soybean market price (Figure 2). Key Messages Based on previous trials at the Monsanto Learning Center near Gothenburg, NE, and the results of this trial, a seeding rate of above 140,000 seeds/acre has the most adaptability when considering fluctuating market conditions. This seeding rate provides an adequate plant stand to take advantage of yield potential within a given environment. Monsanto Learning Center at Gothenburg, NE / Page 43
44 MONSANTO the LEARNING CENTER Irrigated Soybean Density Return less seed cost ($/acre) , , , , , ,000 Plant Population (seeds/acre) $10.40/bu $14.50/bu Figure 3. Population and Profitability in a Fluctuating Soybean Market Sources 1 Rees, J., Glewen, K., Zoubek, G., and VenDeWalle, B Nebraska on-farm research network soybean seeding rate findings. University of Nebraska-Lincoln. 2 Ciampitti, I. A., Roozeboom, K., and Haverkamp, B Soybean seeding rates and optimum plant populations. Kansas State University. eupdate Issue Web sources verified 11/17/14. Legal The information discussed in this report is from a single site, replicated research or demonstration trial. This informational piece is designed to report the results of this demonstration and is not intended to infer any confirmed trends. Please use this information accordingly. Monsanto Company is a member of Excellence Through Stewardship (ETS). Monsanto products are commercialized in accordance with ETS Product Launch Stewardship Guidance, and in compliance with Monsanto s Policy for Commercialization of Biotechnology- Derived Plant Products in Commodity Crops. Commercialized products have been approved for import into key export markets with functioning regulatory systems. Any crop or material produced from this product can only be exported to, or used, processed or sold in countries where all necessary regulatory approvals have been granted. It is a violation of national and international law to move material containing biotech traits across boundaries into nations where import is not permitted. Growers should talk to their grain handler or product purchaser to confirm their buying position for this product. Individual results may vary, and performance may vary from location to location and from year to year. This result may not be an indicator of results you may obtain as local growing, soil and weather conditions may vary. Growers should evaluate data from multiple locations and years whenever possible. ALWAYS READ AND FOLLOW PESTICIDE LABEL DIRECTIONS. Leaf Design is a registered trademark of Monsanto Company. All other trademarks are the property of their respective owners Monsanto Company MEC Page 44 / 2014 Demo Report
45 Dryland Soybean Row Spacing Optimal genetics, good agronomic practices, and favorable environmental conditions are necessary to help increase soybean yield potential. Proper row spacing is an important agronomic practice that can affect soybean yield potential. However, soybean plants are relatively insensitive to small differences in between-row and within-row plant spacing. 3 Background Recent soybean row spacing trial results have shown the following: Results of 14 soybean row spacing trials conducted by the University of Nebraska-Lincoln showed 10-inch rows, 20-inch rows, and 30 inch rows yielded 47.8 bu/ acre, 46.8 bu/acre, and 44.6 bu/acre respectively. 1 Iowa State University soybean row spacing trials indicated 15-inch rows yielded 70.9 bu/acre while 30- inch rows yielded 66.4 bu/acre. 2 Kansas State University soybean row spacing trials that included 10-inch, 20-inch, and 30-inch rows showed no statistically significant difference in yield due to row width dryland soybean row spacing demonstration trials at the Monsanto Learning Center near Gothenburg, NE, showed no statistically significant difference in yield when comparing 7.5-inch drilled rows, 15-inch drilled rows, 30-inch rows, and twin rows. Study Guidelines A soybean row spacing demonstration trial was conducted at the Monsanto Learning Center near Gothenburg, NE, to evaluate if soybean narrow row spacings provided a consistent yield benefit over wide row spacings. Also, different maturity soybean products were seeded to determine if similar yield responses would be received under various row spacings. Treatments Four row spacings: 7.5-inch drilled, 15-inch drilled, twin rows, and 30-inch row. Three soybean products consisting of maturity groups 2.8, 3.0, and 3.2 were planted at all row spacings. The demonstration trial was no-tilled into corn stalks at 160,000 seeds/acre on May 15. Weed control consisted of Authority MTZ DF and Roundup PowerMAX applied PRE followed by a later POST application of Warrant Herbicide, Select Max, and Roundup PowerMAX. There were no foliar insecticide or fungicide applications. Each treatment was 10 feet by 100 feet and there were four replications. Results Yield results were combined across soybean products. There was no statistically significant soybean product by row spacing interaction. Also, there was no statistically significant difference in yield between row spacings in a dryland environment. All treatments experienced hail damage approximately a week before harvest that shelled out about 20% of the mature pods. Key Messages The yield advantage to narrow row spacing is generally attributed to full canopy development by early pod growth stage, which helps maximize sunlight interception. In low yield environments, a yield difference due to different row spacings is not as likely. The results in this trial combined with previous trials, demonstrate variability in soybean yield levels across different row spacing's on a year to year basis. Monsanto Learning Center at Gothenburg, NE / Page 45
46 MONSANTO Yield (bu/acre) the LEARNING CENTER Dryland Soybean Row Spacing LSD (0.1) = NS 7.5" drilled 15" drilled Twins 30" rows Harvested Yield Figure dryland soybean row spacing. All treatments experienced hail damage about a week prior to harvest that shelled out about 20% of the mature pods. Sources 1 Elmore, R.E., Moomaw, R.S., Selley, R., Narrow-row soybeans. NebGuide G University of Nebraska-Lincoln. viewcontent.cgi?article=1741&context=extensionhist 2 Pedersen, P Row spacing in soybean. Iowa State University Extension. 3 Roozeboom, K. Interaction of soybean maturity, row spacing and seeding rate. Kansas State University. recordingredirect.cgi/id/ 4 Row spacing in soybean production. Demonstration Report. Monsanto Learning Center at Gothenburg, NE, Technology Development and Agronomy Web Sources verified 11/18/14. Legal The information discussed in this report is from a single site, 4 replications research or demonstration trial. This informational piece is designed to report the results of this demonstration and is not intended to infer any confirmed trends. Please use this information accordingly. Roundup Technology includes Monsanto's glyphosate-based herbicide technologies. Individual results may vary, and performance may vary from location to location and from year to year. This result may not be an indicator of results you may obtain as local growing, soil and weather conditions may vary. Growers should evaluate data from multiple locations and years whenever possible. ALWAYS READ AND FOLLOW PESTICIDE LABEL DIRECTIONS. Warrant Herbicide is not registered in all states. Warrant Herbicide may be subject to use restrictions in some states. The distribution, sale, or use of an unregistered pesticide is a violation of federal and/or state law and is strictly prohibited. Check with your local Monsanto dealer or representative for the product registration status in your state. Roundup PowerMAX, Roundup Technology, Roundup and Warrant are registered trademarks of Monsanto Technology LLC. Leaf Design is a registered trademark of Monsanto Company. Authority is a trademark of FMC Corporation. All other trademarks are the property of their respective owners Monsanto Company DLB Page 46 / 2014 Demo Report
47 Delayed Harvest Loss of Irrigated Soybean Background Research at several universities has identified potential causes of soybean yield loss at harvest. Combine losses may account for up to 12% of the soybean crop. 1 Aside from losses due to improper set up of combine equipment, yield losses during harvest may be due to: Excessively dry soybean plants that may increase the risk of pod shattering and seed damage. Pods on lodged soybean stems cannot be passed through the combine, which may account for 1% of yield loss. 1 Delayed harvest due to unfavorable weather conditions such as wind or hail event occurring close to harvest or wet conditions. Study Guidelines A replicated soybean demonstration trial was conducted at the Monsanto Gothenburg Learning Center near Gothenburg, NE to provide information on the potential risks of delaying soybean harvest and determine losses that may occur if soybean harvest is delayed. The trial was planted with five soybean products with relative maturity (RM) of 2.4, 2.6, 2.7, 3.0, and 3.2. Treatments included five planting dates: 4/23/2014 5/28/2014 5/2/2014 6/4/2014 5/14/2014 The trial was conducted on corn rotated ground. Soil was prepared under no-till system. No foliar fungicide or insecticide was applied. Pre-emergent herbicides of Authority MTZ DF and Roundup PowerMAX were applied. Warrant Herbicide, Select, and Roundup PowerMAX were applied post-emergence. Plots were fully irrigated with 5 inches of water applied over the growing season. The study was setup as a small plot research trial with three replications. All soybean products were tested at all planting dates. This research was initially designed to evaluate the effect of planting date on soybean yield; however, due to October 1st hail and wind event resulting in pod shattering, the focus of the study was changed to discuss losses, which can occur when soybean plants are mature and harvest is delayed. Results Results are summarized in the figures and tables that follow. Pod Pod Shattering (%) (%) of of Soybean Yield Yield LSD (0.1) = RM 3.2RM 2.4RM 2.7RM 3.0RM Days Delayed Before Harvest Figure 1. Percent of pod shattered of five soybean products planted at different dates. Monsanto Learning Center at Gothenburg, NE / Page 47
48 MONSANTO the LEARNING CENTER Delayed Harvest Loss of Irrigated Soybean Table 1. Percent of pod shattered of five soybean products planted at different dates. Planting Date 23-Apr 2-May 14-May 28-May 4-Jun Delayed Harvest (days) Product Page 48 / 2014 Demo Report Pod Shattering (% ) of Soybean Yield 2.4RM RM RM RM RM Yield (bu/acre) LSD (0.1) = 3.9 April 23 May 2 May 14 May 28 June 4 Potential Increase Harvested Yield Figure 2. Delayed harvest loss of five soybean products planted at different dates.


49 Delayed Harvest Loss of Irrigated Soybean Key Messages Generally, more pods shattering was observed when harvest was delayed than for those soybean plants that recently reached maturation and were ready to be harvested. Decrease potential harvest losses by: Timely harvest of soybean plants to help minimize substantial yield loss due to unforeseen circumstances. Planting soybean products with different maturities and planting dates allowing more flexibility if one is unable to quickly harvest soybean plants when pods are mature due to equipment/ manpower limitations. Source 1 Shay, C., Ellis, L., Hires, W Measuring and reducing soybean harvesting losses. University of Missouri Extension. G Legal The information discussed in this report is from a single site, replicated research or demonstration trial. This informational piece is designed to report the results of this demonstration and is not intended to infer any confirmed trends. Please use this information accordingly. Roundup Technology includes Monsanto's glyphosate-based herbicide technologies. Individual results may vary, and performance may vary from location to location and from year to year. This result may not be an indicator of results you may obtain as local growing, soil and weather conditions may vary. Growers should evaluate data from multiple locations and years whenever possible. ALWAYS READ AND FOLLOW PESTICIDE LABEL DIRECTIONS. Warrant Herbicide is not registered in all states. Warrant Herbicide may be subject to use restrictions in some states. The distribution, sale, or use of an unregistered pesticide is a violation of federal and/or state law and is strictly prohibited. Check with your local Monsanto dealer or representative for the product registration status in your state. Roundup PowerMAX, Roundup Technology and Warrant are registered trademarks of Monsanto Technology LLC. Leaf Design is a registered trademark of Monsanto Company. Authority is a trademark of FMC Corporation. All other trademarks are the property of their respective owners Monsanto Company SMK Figure 3. Aerial photo of soybean plots taken mid-september with brown blocks representing early maturing soybean products. Each plot is four rows wide by 17.5 feet. Figure 4. Comparison of the growth and development of a 2.4RM soybean product planted in late April and June Photos taken 2nd week of August. Monsanto Learning Center at Gothenburg, NE / Page 49


50 MONSANTO the LEARNING CENTER Delayed Harvest Loss of Irrigated Soybean Figure 5. Comparison of the growth and development of a 3.2RM soybean product planted in late April and June Photos taken 2nd week of August. Page 50 / 2014 Demo Report Figure 6. Hail damaged soybean plants with shattered pods prior to harvest.
51 Notes Monsanto Learning Center at Gothenburg, NE / Page 51


52 LEARNING the MONSANTO CENTER Monsanto Learning Center Hwy 47 Gothenburg, NE