Cooperative movement in Bulgaria:
|
|
|
- Carol Hodge
- 5 years ago
- Views:
Transcription

1 Cooperative movement in Bulgaria: Development, challeges and opportunities Darina Zaimova, EURICSE


2 Cooperative movement in Bulgaria Agricultural policy in Italy Development of the agricultural sector Stochastic frontier analysis main results and conclusions Key-elements of successful and working strategy

 14,0 41,7 6,8 Liquidation of land ownership")
3 The beginning credit cooperative Land ownership 0,1 1 ha 1 4 ha ha Total Land ownership in 1934 and in (%) 3,0 29, ha 47,9 36,6 16,6 > 20 ha 3,1 0,9 100,0 1946(%) 14,0 41,7 6,8 Liquidation of land ownership 100,0
4 st st stage stage 1 st st farms ha 135,000 farms cooperatives nd nd stage stage 2 nd nd Collectives
 Collapse of communism; (2) New direction?")
5 (1) 98 % concentration of land; (2) Payment of land rents in the collectives was discontinued. Labor Collective Agricultural Farms Agro-industrial complexes Re-establishment of collectives (1) Collapse of communism; (2) New direction? (1) Total number - 289; (2) Producers wage laborers.
6 Pre-reform agricultural structures (1985) Number Average arable land (ha) Total arable land (ha) Share Agro-industrial complexes ,8 80,87% Comprising of: Labour agricultural cooperatives ,0 58,3% State agricultural farms ,6 8,8% Machine and tractor stations ,0% Brigades na na 631,2 13,6% Other agricultural organizations ,2 6,2% Private plots ,38 609,0 13,1% Total ,0 100,0%


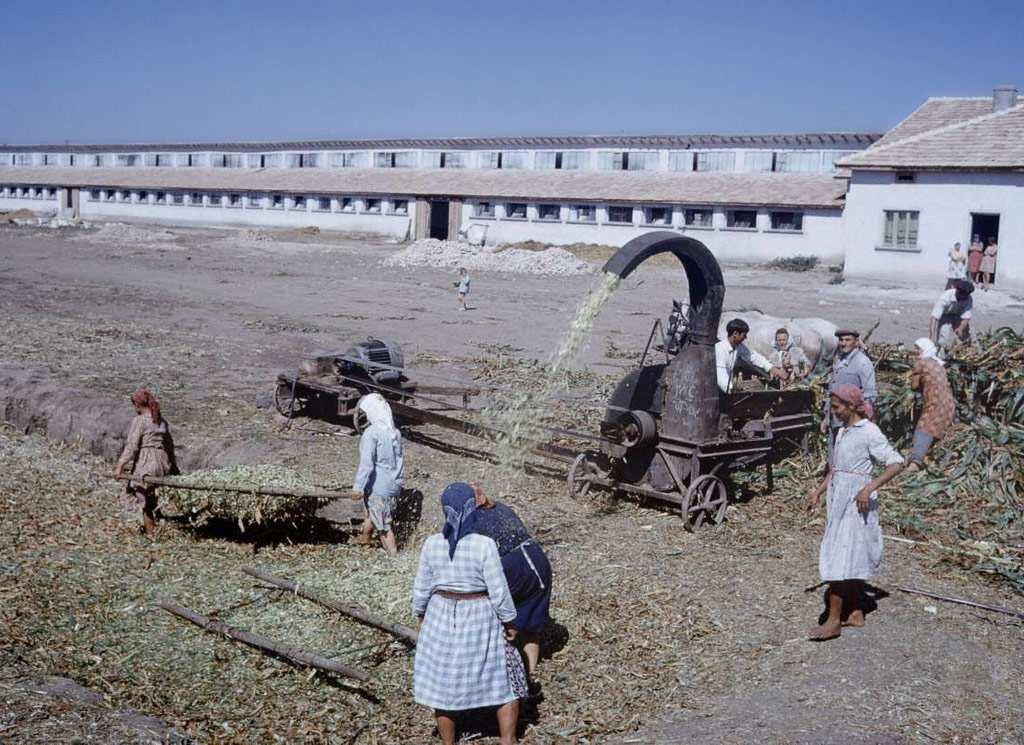
7 Village Kaloianovo Silage ( ) Village Sokolovo -1961
8 Progress reforms 1. Pre-reform farm type 2. Agency in charge of realizing previous land ownership : 3. Progress of privatization in terms % of state/ cooperative land: 4. State farm transformation: 5. Cooperative farm transformation 6. Size of farms 7. Land transactions 8. Farmer associations Cooperative: 100 % Municipal Land Commission; Liquidation Councils. For 11% of land: owners have land titles; For 76% of land: owners have provision titles. State farms do not exist Main characteristics 5.1. Old owners who are to have land restituted using real borders (original plots of land), but reduced by a reduction factor Previously landless to be allocated state land and then other land Basis for distribution of farm assets formula for distribution: 50% on basis of (newly distributed) land ownership; 50% on basis of work done in the cooperative. General practice is that farmers who have outstanding claims to land may make use of 80% of that land, while claim process is settled; Legal limits on farm size 20-30ha per family, depending on soil quality Land selling is not allowed in first 3 years, unless to family or state; Land renting is allowed. There are current logistics cooperatives for trade; Farmers are not allowed to start new production cooperatives until the ownership of the land has been established.
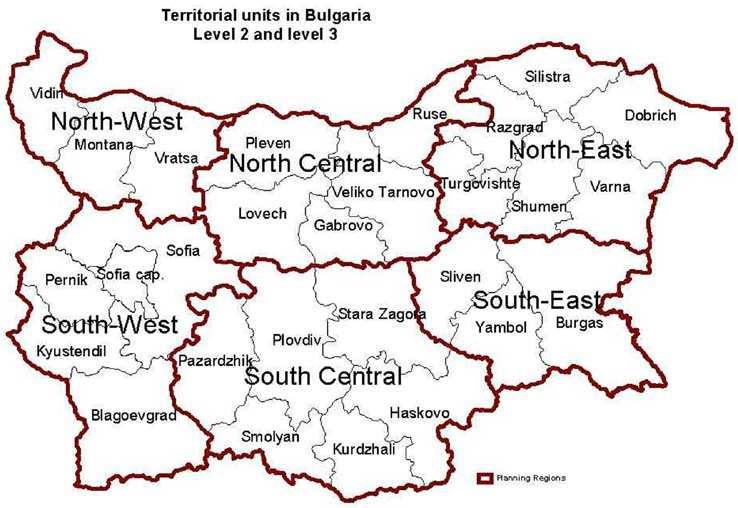
9 Constitution of the Republic Bulgaria Article 19/ paragraph 4 The law shall establish conditions conducive to the setting up of cooperatives and other forms of association of citizens and legal entities in the pursuit of economic and social prosperity. Article 20 The State shall establish conditions conducive to the balanced development of the different regions of the country, and shall assist the territorial bodies and activities through its fiscal, credit and investment policy.
10 Structure of agricultural holdings and size of land in 1996 Number of Agricultural land Average size of holdings holdings (thousand ha) (ha) Public-owned ,2 2554,2 Cooperatives ,6 621 Farms ,2 1,6 Total 6203,0
11 The The Issues Issues PROBLEMS INVESTMENTS LEGISLATION PRIVATE SECTOR (1) Market access; (2) Technical capacity; (3) Quality. (1) Infrastructure; (2) Extension services; (3) Sustainable management of natural resources. (1) Input and output markets; (2) Enforcement regime; (3) Financing mechanisms; (4) Environmental and food-safety requirements. (1) Collaboration among producers; (2) Diversification of economic activities; (3) Enhancing management capacity.
12
13
14 Dynamics of agricultural holdings and size of land Legal status Number of holdings Agricultural land, ha Individual 515, , , , Sole holders 2,158 1, , ,786.2 Cooperatives 1,525 1, , ,305.5 Companies 1,312 1, , ,884.5 Associations , ,300.7
15 Structure of agricultural production - subsistence to market oriented farms Total Only of the surplus production Regular sales Total Only of the surplus production Regular sales Farms trading with fresh vegetables Farms trading with fresh fruits South Eastern planning region South Central planning region
16 Do you have intentions and financial resources to expand your production? 17% 17% 66% Yes I would like to, but have no opporunity No Are you acquainted with the role and functions of producers groups? 15% 24% Yes, and I am a member. 61% Yes, but I am not a member. No, I am not.
17 Until created legislative basis in respect to the European requirements, as well as administrative structures and capacity; and administration responsible for implementing SAPARD program was accredited. From 2002 until 2004 the main objectives are: (a) adaptation of production and output to market requirements; (b) jointly placing goods on the market, including preparation for sale, the centralization of sales and supply to bulk buyers; and (c) establishment of common rules on production information, with particular regard to harvesting and availability. From 2005 until 2007 efforts were aimed at encouraging setting up producers groups, development of already created administrative capacity and improvement of links between administration at different levels and producers.
18 After After European European Accession Accession Number of registered agricultural holders in the Land Parcel Identification System (LPIS) Enterprises Members Employees Sector CCU Consumers NUWPC Industry&Services Central Co-operative Bank Banking Total number
19 Indicative breakdown by Rural measures (in current EUR prices) Training, inform ation and diffusion fo knowledge 112. Setting up of young farm ers 121. Modernization of agricultural holdings 122. Im proving the econom ic value to agricultural and forestry products 123. Adding value to agricultural and forestry products 141. Semisubsistence farm ing 142. Setting up producers groups 143. Provision of farm advisory and extension services in BG and R
20 Support of agricultural sector and rural development ( ) Rural Development Plans Guarantee section of EAGGF Objective 1 - regions Italy - RDP -Guidance section of EAGGF -European Regional Development Plans -European Social Fund -Financial Instrument for Fisheries Guidance -Guarantee section of EAGGF Italy - regions Guarantee section of EAGGF Regional Operational Programs
21 Comparison of the funding programming in the EU ( ) EU - 15 Outside Obj.1 EAGGF Guarantee (excluding Leader +) In Objective 1 EAGGF Guarantee and Guidance Cyprus & Malta Outside Obj.1 In Objective 1 TRDI + EAGGF Guidance EAFRD Bulgaria & Romania SAPARD Croatia FYROM & TR SAPARD IPA EAFFF European Agricultural Guidance and Guarantee Fund SAPARD Special Pre-accession Program for Agriculture and Rural Development TRDI Temporary Rural Development Instrument EAFRD European Agricultural Fund for Rural Development IPA Instrument for Pre-Accession Assistance Rural Development component
 AXIS IV AXIS III RURAL")

22 Intervention strategy of RDP ( ) AXIS IV AXIS III RURAL AREAS LEADER AXIS II ENVIRONMENT AND COUTRY SIDE AXIS I COMPETITIVENES OF AGRI SECTOR
23 Development of the agricultural sector in Italy Agricultural policy Agricultural enterprises Market Business evaluation Market strategies Evaluation of strategies Business strategies Evaluation of business influence Management systems Management systems Strategies efficiency Market influence
24 Perspectives of participants in the agri-food chain Food companies Retailers Consumers Environmental measures; Market segmentation; Product innovation; Exploiting competitive advantage of the regions. Quality standards; Extension of after-sell services. Quality of consumption
25 Fruit and vegetable farms Cooperatives Processing industry Wholesale markets Supermarkets/ Specialist shops Open-air markets Supermarkets Consumer
26 Production, marketed through PO (.000 euro) Sardegna Sicilia Calabria Basilicata Puglia Campania Molise Abruzzo Lazio Marche Toscana Emilia-Romagna Friuli-Venezia Giulia Veneto Provincia Autonoma Trento Provincia Autonoma Bolzano-Bozen Lombardia Piemonte
27 Imported fresh milk Domestic production National Supply Self Consumption Industrial transformation Direct Consumption Other Products Cheese
28 Producers Producers of grapes Producers of wine Cooperatives Private processors Retailers Consumers: supermarkets, specialist shops, catering, others
29 Total 2, , , Sardegna 10, , Sicilia 6, , , Calabria 1, , ,86 96 Basilicata 11, , , Puglia 8, , , Campania 0, , Molise 2, , , Abruzzo 6, , , Lazio 2, , , Marche 2, , , Umbria 3, , , Toscana 12, , , Emilia-Romagna 3, , , Friuli-Venezia Giulia 7, , , Veneto 3, , , Trentino Alto Adige 5, , , Lombardia 1, , ,18 61 Liguria 0, , ,87 45 Valle d'aosta 5, , , Piemonte % % % Region
30 Constitution of the Italian Republic Article 45 The Republic recognises the social function of co-operation of a mutually supportive, non-speculative nature. The law promotes and encourages cooperation through appropriate means and ensures its character and purposes through appropriate checks. The law safeguards and promotes the handicrafts.
31 Parameters in translog production function Standard gross margin Output (Y) The total output in mln euro minus variable costs Input (X) B 1 - Utilized agricultural area (UAA) B 2 - Permanent crops (PC) Gross added value Output at market prices minus intermediate consumption at purchaser prices B 3 - Intermediate consumption (IC) B 4 - Annual working unit (AWU) B 5 - Employed annual working unit (EAWU)
32 Parameters in inefficiency model Group 1: General information about agricultural enterprises Group 2: Characteristics of the institutional framework C 1 - Training level C 2 - Specialized mixed farming C 3 - Protection of property right C 4 - Legal enforcement of contracts C 5 - Starting a business C 6 Cooperatives
33 LR-test results Test Null Hypothesis Loglikelihood function Value λ** Critical Value* Decision H 0 : b i = 0-16, , ,689 Reject H 0 2 H 0 : b ij = 0-6,1317 3,1885 2,706 Reject H 0 3 H 0 : γ = δ i = 0 28, , ,670 Reject H H 0 : b i = 0-11, ,059 25,689 Reject H 0 2 H 0 : b ij = 0 18,8789 8,1042 2,706 Reject H 0 3 H 0 : γ = δ i = 0 23, , ,670 Reject H H 0 : b i = 0-6, ,821 25,689 Reject H 0 2 H 0 : b ij = 0 25, ,2112 2,706 Reject H 0 3 H 0 : γ = δ i = 0 17, ,169 17,670 Reject H 0 *.005 significance level ** λ is the value of the likelihood ratio test of the null hypothesis associated with each of the three models against the alternative general model. This test has 16 degree of freedom.
34 Variable P Constant b 0-0,7908* 0,6725-0,2029* Utilized agricultural area (UAA) b 1 0-0,1172* -0,1238* Permanent Crops (PC) b 2 0,8247 0,9692 0,1031 Intermediate consumption (IC) b 3 0,8303 0,9025 0,8123 Annual Working Unit (AWU) b 4 0,2616 0,9134 0,3913 Emloyed annual working unit (EAWU) b 5 0,2589 0,1012-0,7683* Time b 6 0,1466 0,5647-0,8315* 0,5*(UAA) 2 b 7 0,4705 0,3828-0,9134* 0,5*(PM) 2 b 8 0,1815 0,2735 0,1151 0,5*(IC) 2 b 9-0,1377* 0,467 0,9566 0,5*(AWU) 2 b 10 0,1335-0,1071* -0,5040* 0,5*(EAWU) 2 b 11 0,3775-0,8212* -0,6061* (UAA)*(PC) b 12 0,2043-0,4764* -0,5889* (UAA)*(IC) b 13-0,7427* -0,2406* -0,1773* (UAA)*(AWU) b , (UAA)*(EAWU) b 15 0, ,2910* (PC)*(IC) b 16 0,5685 0,5632-0,2454* (PC)*(AWU) b 17 0,673-0,4686* 0,7666 (PC)*(EAWU) b 18 0,2785 0,6672 0,1459 (IC)*(AWU) b 19 0,6684-0,2201* -0,9165* (IC)*(EAWU) b 20-0,5370* -0,7264* -0,2433* (AWU)*(EAWU) b 21 0,4032 0,2157 0,6075 Variance parameters: δ² 0,1262 0,0128 0,0063 γ 0,5 0,7348 0,7181
35 Inefficiency model results 0,8000 0,6000 0,4000 0,2000 0,2641 0,2423 0,3458 0,1037 0,5733 0,2008 0,3826 0,0000-0,2000-0,4000-0,6000-0,8000-1,0000-1, ,2213-0,3030-0,3348-0,3307-0,4592-0,6378-0,7365-0,9564 Training level (TrLevel) Specialized mixed farming (SMF) Property right protection (PRP) Legal enforcement of contract (LEC) Starting new business (SNB)
36 Elasticity of substitution between pairs of inputs* Year b 12 b 13 b 14 b 15 B 23 B 24 B 25 B 34 B 35 B 45 SCE ,204-0,743 0,000 0,238 0,569 0,673 0,279 0,668-0,537 0,403 0, ,476-0,241 0,209 0,000 0,563-0,469 0,667-0,220-0,726 0,216 2, ,927-0,280 0,390 0,000 0,232-0,120 0,523-0,973-0,221 0,378 2,002 Sample mean -0,400-0,421 0,300 0,079 0,455 0,028 0,489-0,175-0,495 0,332 1,625 AC 0,700 0,545 0,511 0,668 * Note: b 12 is elasticity of substitution between AUU and PC, b 13 is elasticity of substitution between UAA and IC, b 14 is elasticity of substitution between UAA and AWU, b 15 is elasticity of substitution between UAA and EAWU, b 23 is elasticity of substitution between PC and IC, b 24 is elasticity of substitution between PC and AWU, b 25 is elasticity of substitution between PC and EAWU, b 34 is elasticity of substitution between IC and AWU, b 35 is elasticity of substitution between IC and EAWU, b 45 is elasticity of substitution between AWU and EAWU
37 0,415 0,594 0,112 0,917 0,198 0,594 Sardegna 0,284 0,694 0,121 0,889 0,132 0,754 Sicilia 0,433 0,567 0,131 0,869 0,024 0,690 Calabria 0,148 0,513 0,113 0,858 0,268 0,588 Basilicata 0,436 0,689 0,098 0,906 0,229 0,597 Puglia 0,326 0,626 0,140 0,909 0,082 0,902 Campania 0,411 0,552 0,247 0,802 0,210 0,667 Molise 0,177 0,871 0,053 0,958 0,209 0,681 Abruzzo 0,359 0,590 0,142 0,828 0,128 0,704 Lazio 0,355 0,531 0,055 0,947 0,268 0,576 Marche 0,399 0,613 0,025 0,966 0,291 0,545 Umbria 0,145 0,631 0,024 0,812 0,184 0,721 Toscana 0,086 0,926 0,034 0,958 0,187 0,682 Emilia-Romagna 0,420 0,361 0,047 0,958 0,031 0,865 Friuli-Venezia Giulia 0,320 0,765 0,003 0,974 0,209 0,801 Veneto 0,085 0,551 0,077 0,878 0,240 0,549 Trento 0,147 0,512 0,085 0,881 0,106 0,795 Bolzano 0,023 0,972 0,036 0,969 0,124 0,856 Lombardia 0,232 0,403 0,071 0,925 0,188 0,783 Liguria 0,143 0,559 0,119 0,875 0,209 0,596 Valle d'aosta 0,408 0,638 0,038 0,924 0,059 0,689 Piemonte St.Dev Average St.Dev Average St.Dev Average Z - variables Translog Cobb-Douglas
38 Mean efficiency coefficients Production function Average Std.dev Cobb-Douglas 0,782 0,667 0,642 0,697 0,075 Translog 0,942 0,928 0,862 0,905 0,035 Z-Variables 0,370 0,731 0,779 0,627 0,070
39 Balanced productivity growth in the 21 regions is supported by the contribution of efficiency change to the total factor productivity. Specialization occurs to enhance production costs reduction. Positive change in distribution of labor input in specialized production has underlying effect on efficiency growth, during the studied period. Introduction of specialized mixed farming has improved land utilization and distribution among different crops. Legal enforcement of contracts contributes to holding empowerment and collective action to regulate agricultural production. Cooperatives prove to be dynamic and influential organizational structures that make substantial contribution to the overall technical efficiency.
40 Thank you!