AGRICULTURAL PRODUCTIVITY
|
|
|
- Blake Jackson
- 5 years ago
- Views:
Transcription
1 Chapter Four AGRICULTURAL PRODUCTIVITY 4.1 Introduction 4.2 Inputs Used 4.3 Methodology 4.4 Bhatia s Method 4.5 Crop Productivity And Changes Jowar Whet Rice Sugarcane Groundnut Gram 4.6 References
2 Chapter four AGRICULTURAL PRODUCTIVITY 4.1 INTRODUCTION The previous chapter is devoted to the study of land use, irrigation and cropping pattern cropping pattern and changes there in. The present chapter aims to analyze, how far irrigation has changed the agricultural productivity. The term agricultural productivity is both a dynamic relative concept it is used to express the efficiency of agriculture.agricultural productivity is the level of existing performance of a unit of land which differentiates from one area to another agricultural productive of an area is influenced number of physical social, institutional and organizational factors, beside these their productivity also depends on availability of labour supply of capital and encouragement by the government. Thus it is the result of combined interplay of physical and human factor. 4.2 INPUTS USED Generally the inputs means the factors on which the development of agriculture is depend. Mechanical biological and chemical inputs are playing important role in transformation of agricultural crop yield in the study region. It is noted in field observation that the adoption of form technology is increasing found in the irrigated areas. The improved iron plough, tractors, electric pumps, seedlings spray pumps, duster, sugarcane crusher are the modern machinery. Wooden plough is traditional implement largely used in un irrigated hilly parts of the Satara District. Iron plough is used for deep ploughing as compare to wooden plough. The formers are showing progressive trend in the use mechanical inputs. The mechanization is not possible in western and eastern hills areas. However the farmers in the level land of irrigated areas responding positively for the modernization of agriculture. The level of land is always suitable for mechanized farming provided other conditions are favorable sign. 83
3 The adoption of chemical inputs such as HYV seeds has increases as they, respond more rapidly of the fertilizers and water input. There are significant centers in Karad taluka and many more centers in Satara district. Moreover, Satara Zilla Parishad, every Panchayat Samitees of 11 taluka Kharedi-Vikri society of every taluka and private traders related to agricultural inputs provides. a) High yielding verities of seeds. b) Fertilizers c) Crop protection materials 1. Fungicide 2. Weedicide 3. Insecticide 4. Pesticide 5. Germicide d) Organic manures etc. ` Primary agriculture credit society, District central cooperative bank, Land development bank, Money lenders,credit Societies etc. all these are institutional Non institutional sources of finance provide loan and financial assistance to the farmer to purchase bio-chemical inputs. The green manure is also used to maintain the fertility of the soil. Moreover for the protection of sensitive crop all the types of chemicals in both forms i.e. powder and liquid are used (pesticide) to increase the productivity of land. TABLE NO. IV-I SATARA DISTRICT AGRICULTURAL INPUTS Sr. No Agricultural Inputs Total number of Plough a) Wooden b) Steel Total number of bullock carts Sugar crusher a ) Power driven b) Bullock driven Number of Pumps for irrigation a) Oil operated b) Electric Number of tractors Source - Socio Economic Abstracts 1982, 1992,
4 4.3 METHODOLOGY Experts in Agricultural Geography have developed many techniques suitable for the measurement of agricultural productivity. The assessment of agricultural productivity in terms of grain equivalent per head of population was first employed by Back (1937) in his study of land utilization. The need to determine the spatial variations in agricultural productivity statistically was realized by Kendall (1939) who devised for it a method called ranking coefficient. L.D. Stamp (1943) determined agricultural productivity by Kendall s method by selecting number of countries and some major crops. However the method was found to be inaccurate as it did not take note of the real strength of the individual crops. Sapre and Deshpande (1964) tried to eliminate this defect by weighting the ranks of the individual crop by their proportion in the total cropped area in the region. The areal units were graded in ranking order according to their output per unit area and ranking coefficients were derived. Sigh, Jasbir (1972) has attempted to measure the agricultural efficiency of Haryana in terms of nutrition per unit area. Singh Jasbir et. al. (1982) recently applied a technique known as the crop yield and concentration indices ranking coefficient. Bhatia (1967) used the index suggested by Sapre and Deshpande with slight modification. He used Yield Index of crops, instead of yield ranking of individual crops. P. Sen Gupta (1968) also used the same index as prepared by Bhatia for stubbing agricultural efficiency in India. Sinha (1972) has developed the standard deviation and standard core method to determine the agricultural productivity in India at the district level. Shinde, Jadhav and Pawar (1978) measured agricultural productivity of Maharashtra plateau by money value co-efficient method.in the present study first individual crop productivity is assessed to show the variations in 85
5 agricultural productivity by location quotient. Talukas are chosen as the basic areal unit and the span study period covers 20 years from to BHATIA S METHOD The crop productivity is determined by Bhatia s Yield Index method, he suggest that contribution of each for crop agricultural efficiency is in relation to its proportionate share to crop land. Bhatia s formula of agricultural efficiency is as fallows Yc Iya = Yr Where, Iya = yield Index of crop a Yc = is the hectare yield of crop a in the component areal unit Yr = is the hectare yield of crop a in the entire region. Iya ca + Iyb cb +. + Iyn +cn Agricultural Efficiency Index (Ei) = Ca + Cb + Cc +. + Cn. Where, Ei is the agricultural efficiency index Ca, Cb.. Cn are the percentage of crop land under different crops. With this technique the value are computed and depicted. 4.5 CROP PRODUCTIVITY AND CHANGES In the study of agricultural productivity it is of interest to know the general areas where different crops dominate and their contribution in agricultural productivity for this purpose viz. Jowar, Wheat, Rice, Groundnut, Sugarcane, Gram, have been considered. These crops are grown in various part of the district different combination and they contribute significantly total agricultural productivity. 86
6 4.5.1 JOWAR The distribution of the Jowar productivity is plotted in fig.no.4.1 A, B, C. The high productivity (above 200 percent index) was three in the talukas of (Karad percent index), Jowali ( percent index), Wai ( percent index) and Patan ( percent index) and moderate ( percent index) Jowar productivity is recorded in Koregaon ( percent index) Khatav ( percent index) and Satara ( percent index) and low (below 100 percent index) concentration of Jowar productivity and observed in Khandala, Phaltan, Man taluka during because this talukas of study area even today are under drought prone condition(fig.no.4.1a). In the productivity of the Jowar was declined but there was remarkable change in Jowar productivity in Mahabaleshwar taluka i.e. ( percent index) which was just 4 percent during High productivity observed only in Khandala i.e percent index and in remaining talukas moderate productivity of Jowar was there e.g. Wai, Satara, Karad Patan and Jawali. No productivity of Jowar in Phaltan taluka and lowest productivity recorded in Man taluka i.e percent index (fig. No.4.1B) There was tremendous progress in the Jowar productivity of the Satara district during Six talukas of the district recorded more than i.e. high productivity index. Such as Karad (499.59), Koregaon ( percent index), Khatav ( percent index), Satara ( percent index), Jawali percent index. talukas broken all the previous record of productivity of Jowar i.e. 520percent index. Only Man taluka was shown lowest (89.79 percent index) Jawar productivity due to some natural unfavorable condition during (Fig No. 4.1C) 87
7 88
8 4.5.2 WHEAT Fig.No.4.2 A, B and C reveals the spatial pattern of productivity of wheat. The high productivity of wheat was not confined in any single taluka of the district during Moderate wheat productivity recorded in the taluka Koregaon ( percent index) Satara ( percent index) Phaltan (155.42), Patan ( percent index) and Karad ( percent index) 50 percent area of study region covered by Wheat productivity lowest productivity recorded in Mahabaleshwar (8.07 percent index) In also Wheat productivity under above 200 percent index not confined anywhere in the study area. Moderated productivity of Wheat recorded in the taluka like (Phaltan ( percent index) and Karad (123.85percent index) in the rest part of the district under the category of lowest (below 100 percent index) productivity was found in Wai, Man, Khatav,Koregaon, Satara Jawali and Patan taluka of the district lowest productivity of wheat is recorded in Jawali taluka (58.42 percent index) There was no high production wheat in the decade of also. Only Karad and Phaltan talukas were in the moderated category. All other taluka were under the lowest category of the Wheat productivity such as Mahabaleshwar (67.90 percent index), Wai (99.43percent index),khandala (77.89), Man (94.72 percent index) Khatav (85.18 percent index), Koregaon (91.41percent index), Jawali (68.68 percent index) due to lack of irrigation facilities productivity of Wheat was low in the study area 89
9 90
10 4.5.3 RICE The spatial pattern of rice production is depicted in the fig No. 4.3 A, B, C. The productivity rice was not found the taluka like Khandala, Phaltan, Man Khatav and Koregaon taluka as these talukas were under the always drought situation and unfavorable condition only by Satara taluka moderated productivity ( percent index) shown i.e percent index. Low productivity below 100 recorded in the taluka like Mahabaleshwar, Wai Jawalil, Patan and Karad. (Fig No. 3.3 A) Rice productivity was not found in the taluka like Mahabaleshwar, Khandala Phaltan, Man,Khatav these area were under drought condition and moderated productivity (100 to 200 percent index) shown by Patan and Karad (107.60) as these taluka were there in western part of the district during Fig No. 3.3 B In the year the situation was changed and number of non rice productivity of taluka decreased up to 3percent index. Koregaon taluka recorded moderate productivity i.e percent index and remaining taluka shown lowest productivity (below 100 percent index) i.e. Mahabaleshwar (17.48 percent index), Wai (84.99 percent index) Khandala (54.82 percent index, Patan (75.34 percent index), Karad (97.29 percent index) because of lack of irrigation facilities.( Fig. No. 3.3 C) 91
11 92
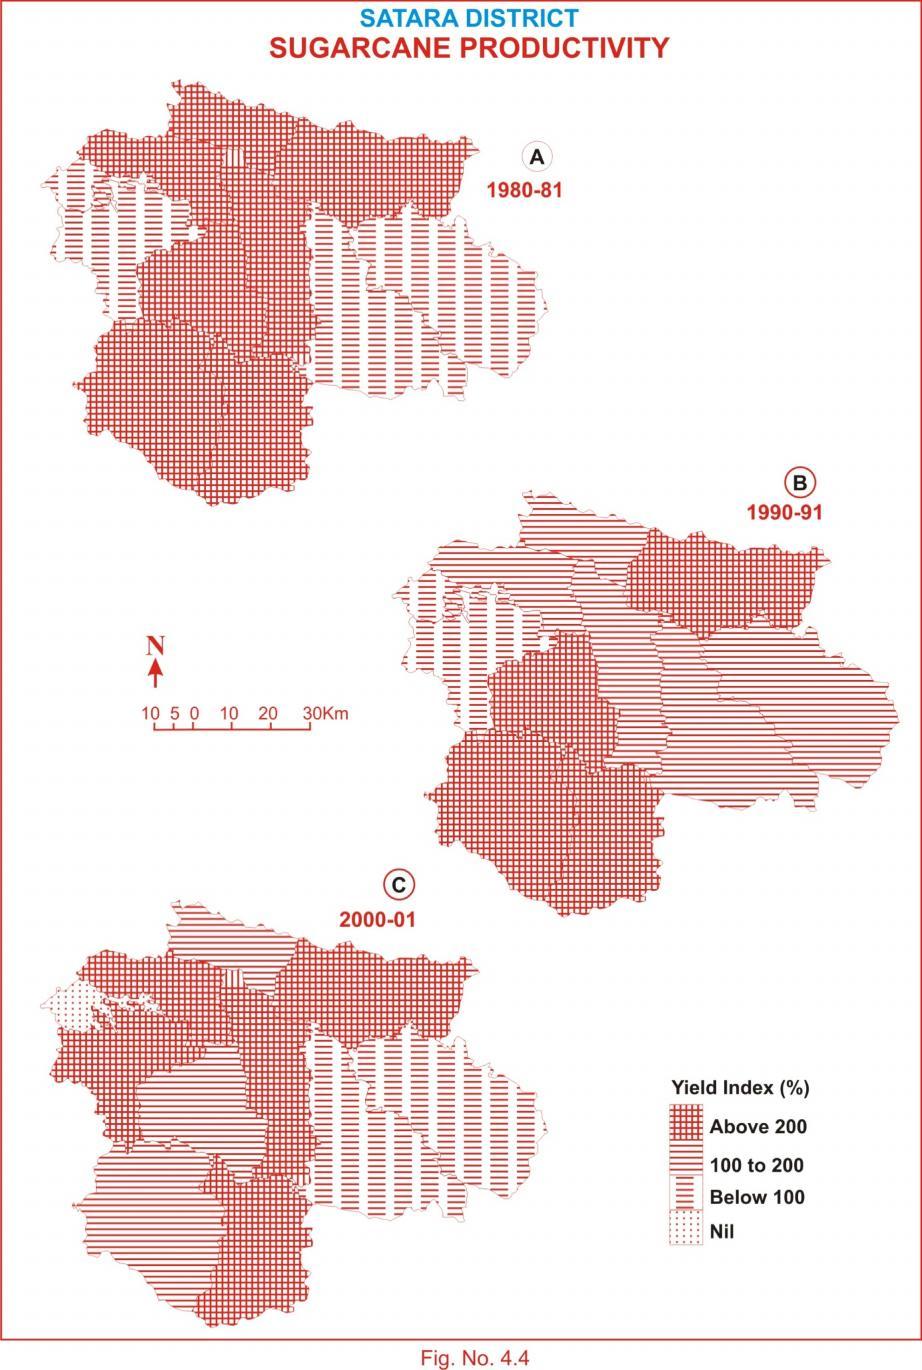
12 4.5.4 SUGARCANE The soil, climate and irrigation facilities are the important factory which determines sugarcane productivity. The productivity of sugarcane is manifestation of integrated impact of factors like physical, social and institutional (Jadhav 1984) the distribution pattern of productivity of sugarcane plotted in Fig.No.4.4 A, B, C. The high (above 200 percent index) productivity was not noted in any taluka of the district in Moderated productivity (below 100 percent index) recorded in the wai (86.20 percent index), Khandala (66.66 percent index) Phaltabn (79.31percent index), Koregaon (73.56 percent index) and Karad (74.71percent index) Mahabaleshwar is in Hilly area and Man and Khatav are under drought condition, no chance of irrigation so any sugarcane productivity shown by them. In the year also no any taluka under the category of high productivity index (above 200percent index) moderate productivity sugarcane is observed in Phaltan ( percent index), Satara (121.8 percent index) and in Karad (101.14).In Mahabaleshwar and Jawali taluka there was no production of sugarcane due to unfavorable geographical condition. Low productivity recorded in Wai, Khandala, Man Khatav,Koregaon and Patan taluka due to absence of irrigation facilities as the sugarcane is irrigated crop requires more water. (Fig 4.4 B) During the year five talukas of satara district gone under the moderate category of sugarcane productivity. But unfortunately there was no any taluka under the category of high productivity. There is 60 percent increase in the area under moderated productivity. There is no modification in high and low productivity of sugarcane. There was no land under sugarcane during in Mahabaleshwar Man and Khatav due to rigid topography and absence of irrigation facilities. Fig 4.4.c) 93
13 94
14 4.5.5 GROUNDNUT The spatial pattern of Groundnut productivity is shown in the Fig 4.5 the nil productivity of groundnut noted in Mahabaleshwar, Phaltan, Man and Khatav. High productivity found in satara (307.6) Phaltan, (257 percent index) Wai (256 percent index) Koregaon (224 percent index) Jawali and Phaltan (234.6 percent index) Special feature of groundnut productivity shown by Karad taluka i.e. 600percent index of productivity in the year During groundnut productivity was declined with special features means no any talukla were under the category of high productivity of ground nut, but by Khatav taluka included in groundnut production with percent index of productivity. Only Koregaon taluka was under the low productivity i.e percent index remaining all taluka recorded moderate productivity of groundnut Wai ( percent index) Khandala (156.50percent index), Satara (111.51percent index) Jawali (133.86) Patan ( percent index) and Karad ( percent index) The groundnut production increased tremendously in the year As usual nil productivity recorded in Mahabaleshwar, Jawali and Patan taluka of the study region. There was no any taluka under moderated category. In Phaltan taluka recorded highest productivity i.e percent index. All remaining talukas included in the high productivity group (above 200 percent index) like Khatav ( percent index, Khandala, ( percent index), Koregaon ( percent index), Karad ( percent index), Satara ( percent index), Wai (253 percent index).due to high yielding varieties of seeds, irrigation facilities and change in attitude of the farmers.(fig.no.5.4 A B and c) 95
15 96
16 4.5.6 GRAM The Fig No. 4.6 A.B, C reveals spatial pattern of gram in the study region. There was nil productivity of Gram in Mahabaleshwar taluka and other taluka under low below 100 productivity of gram, No high and moderate productivity of gram in the year During the year the productivity of gram somewhat improved mean 3 talukas included in moderate (100 to 200) category of productivity i.e. Khandala ( percent index) Phaltan ( percent index), and Patan ( percent index) In Mahabaleshwar taluka there was no production of groundnut so nil productivity of groundnut low a groundnut productivity shown by Wai (89.24 percent index), Man (18.08 percent index), Khatav (74.23 percent index), Koregaon (76.10 percent index) Satara (97.44 percent index), Jawali (98.63 percent index) and Karad (67.57 percent index) compare last 20 years gram production increased so the productivity of gram is also increased during the year
17 98
18 4.6 REFERENCES 1. Ali, M., (1978), "Studies in agricultural Geography", Rajesh Publication, New Delhi., P Hussain, M., (1979), "Agricultural Geography", Inter India Publication, 105, Anandnagar, Delhi, P Jadhav, M.G., (1984), "Sugarcane Cultivation, A regional survey", Himalaya Publishing House, Bombay, P Sapre S.G., and Deshpande V., (1964), "Inter district Variation in Agricultural Efficiency in Maharashtra State", Indian Journal of Agricultural Economics, P.P Sing, J., Dhillon, S., (1984), "Water Resources in India A Geographical Perspective", Geographical Review of India, Vol. 48, No. 4, P Wagh A.S. (2009), "Irrigation and its impact on cultivated area A case study of Satara District". ( to ), Unpublished M.Phil.dissertation Submitted to T.M.V.Pune.PP. 09 to