Biochar. A comparison of biochar volumes to increase plant growth and reduce soil acidity. Research Services LLC Silverton, CO (970)
|
|
|
- Octavia Goodman
- 5 years ago
- Views:
Transcription
")
1 Biochar A comparison of biochar volumes to increase plant growth and reduce soil acidity RS Christopher Peltz Research Services LLC Silverton, CO (970)

2


3
")


4 What is biochar? A carbon-rich (85%) product obtained when biomass is heated in a closed container with little or no oxygen (Lehman, 2009)


5
6 What does biochar do? Increase soil organic carbon; Increase water holding capacity of soils; Increase ph and cation-exchange capacity; Decrease soil bulk density; Increases percentage of 1-2 mm water stable aggregates; Increase population and diversity of soil microorganisms; Sequester carbon (70-80% fixed C/mass); Reduce transport of PAH s in soils Reduce the concentrations of As, Cd, Zn, Pb, Cu, Fe, and N, K in soil leachates
7 Questions Will applying biochar improve soil conditions and increase plant growth? Vegetation growth and vigor Soil moisture dynamics Soil chemistry What are the most effective methods of using biochar for mine lands in terms of $, C, and restoration outcomes? Application rates and methods Determine site or site-type specific restoration methods Conduct large scale and paired experiments

8
9 Southern San Juan Climate Precipitation and temperature patterns for Silverton Colorado. Dashed line - mean monthly temperature (C 0 ), blue area - 95% confidence interval of mean monthly precipitation year record -

10 Cunningham Creek Cement Creek Animas River Mineral Creek


11 Yager, Douglas B., and Bove, Dana J., 2002, Generalized Geologic Map of the Upper Animas River Watershed and Vicinity, Silverton, Colorado: U.S. Geological Survey Miscellaneous Field Studies Map MF-2377, U.S. Geological Survey, Denver, Colorado. Yager, Choate and Stanton USGS Scientific Investigations Report
12 Church, Mast, Martin and Rich 2007 Four Mining Periods: Smelting Gravity Milling Early Flotation Modern Flotation ~121 years # mines, adits, prospects, other sites >5,300 # large mines, mills, milltailings deposits 373 Total ore production ~18.1 Ma short tons Ore discharged to Animas River 8.6 Ma short tons


13 + =

14


15
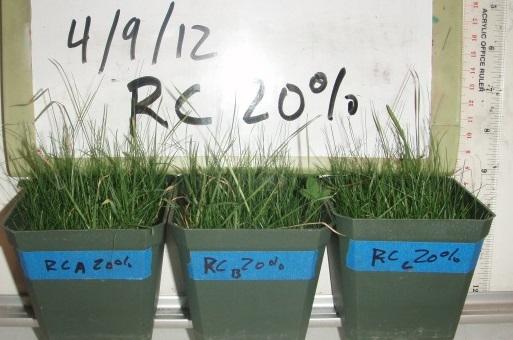
 30% by volume biochar")
 Leachate")
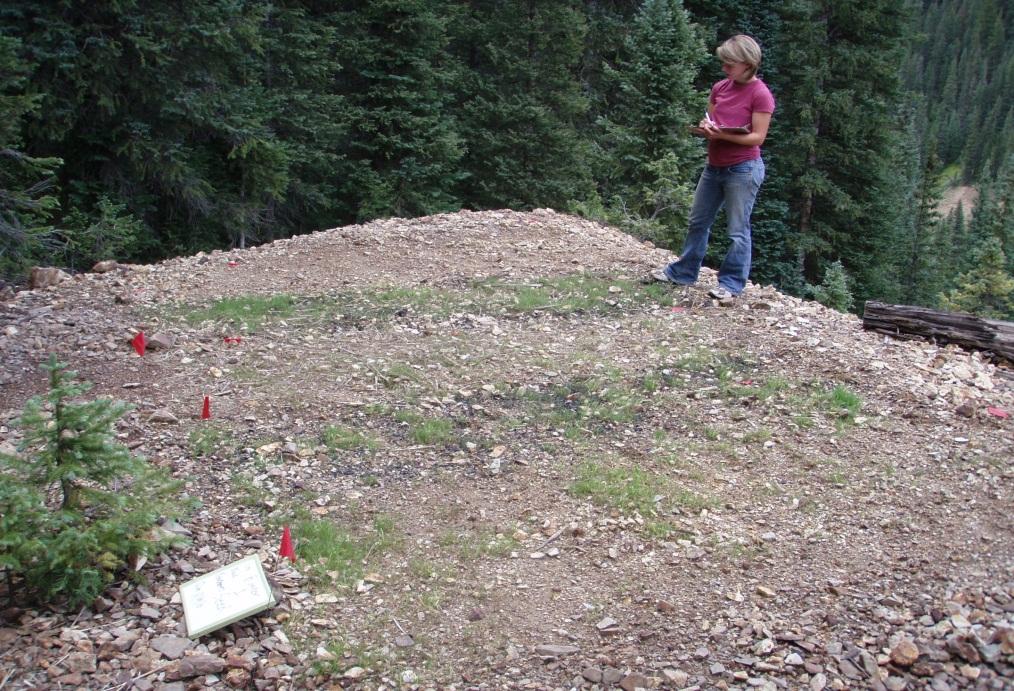
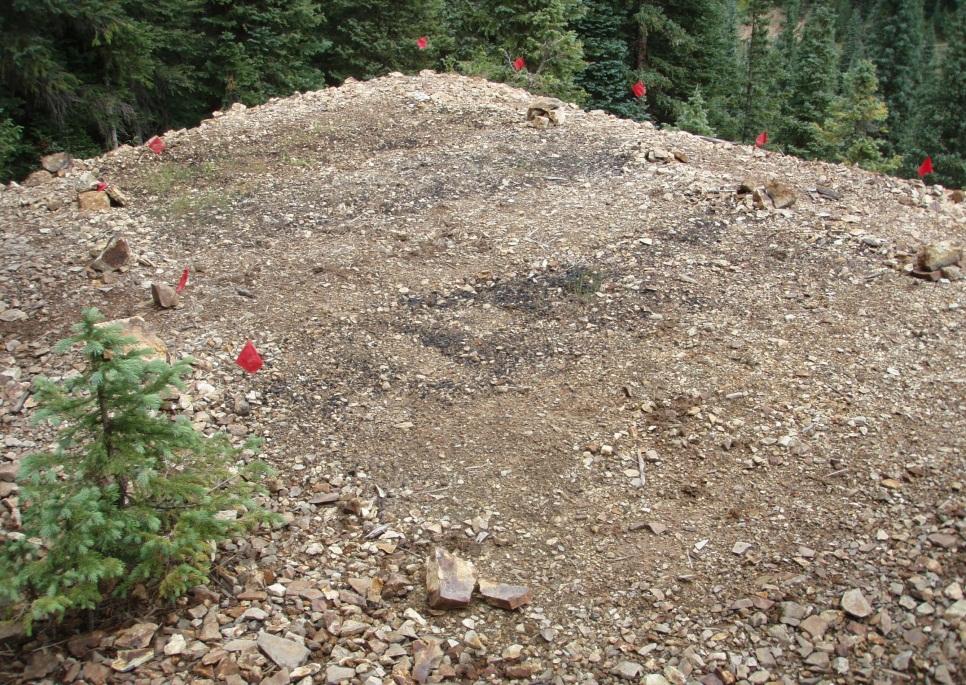
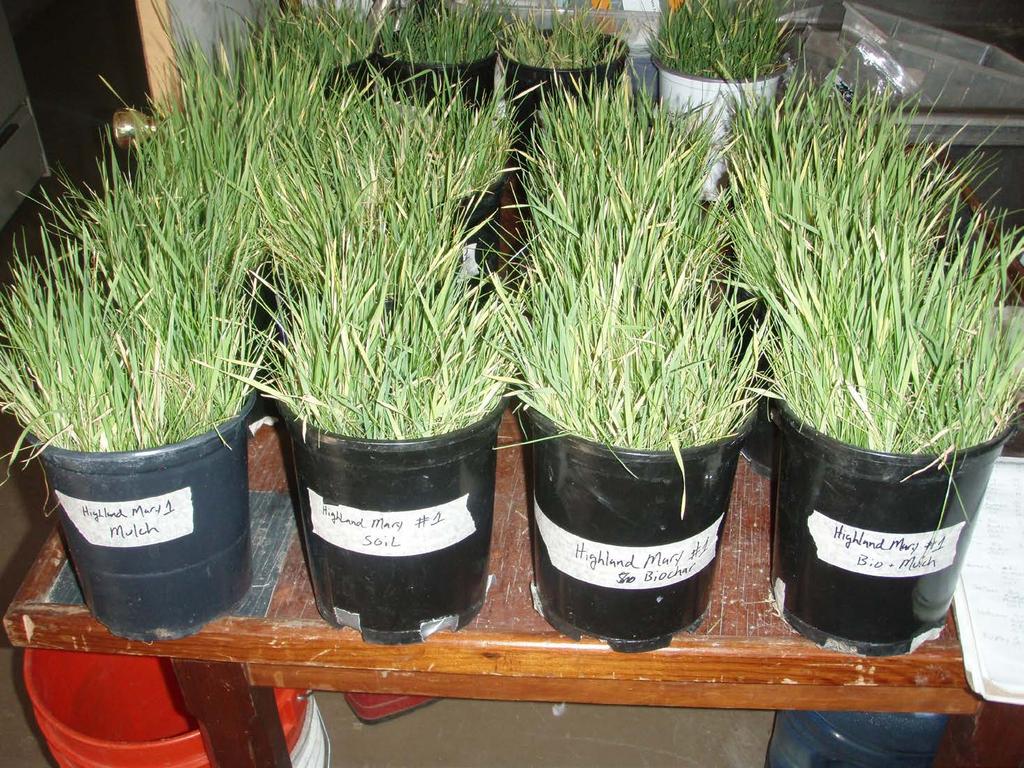
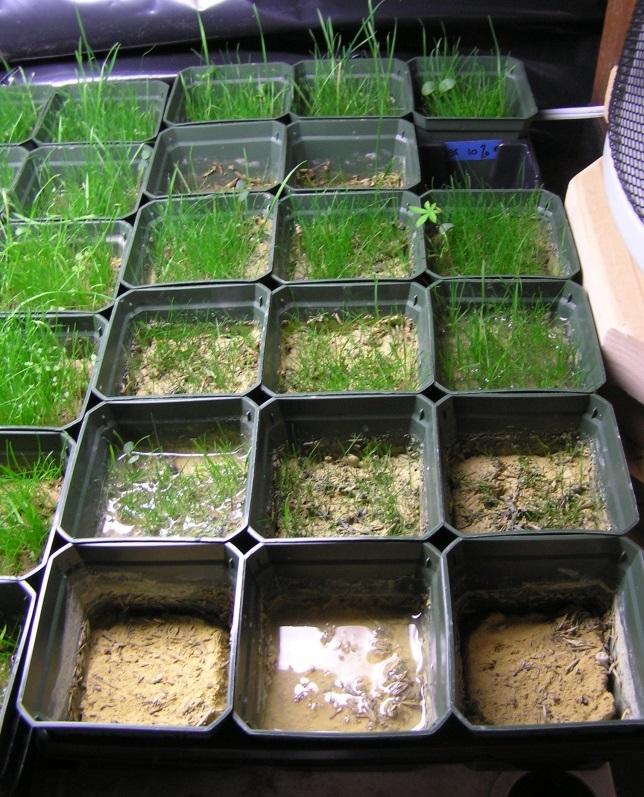
16 Field Randomized block design Three treatments (B, B+M, M) Alpine mix of grasses (USFS supplied) 30% by volume biochar additions VWC (%) Veg cover (%) estimates ~40 days, 1 year after seeding Greenhouse Above ground biomass (g) Leachate chemistry (ICP-MS)


17 Joe John - Lark Mine overburden soils 10,800 ft restoration work since 1999 plant toxic levels of As low water holding capacity Highland Mary Tailings ph 7-8 plant toxic levels of Pb JJ BON LACK LMR HM LMC

18

19
20 Volumetric Water Content(%) field Comparison (mine) Diff of Means P Biochar vs. Mulch <0.001 Biochar vs. Seed Only <0.001 Biochar - Mulch vs. Mulch <0.001 Biochar - Mulch vs. Seed Only <0.001 Biochar vs. Biochar - Mulch Seed Only vs. Mulch Comparison (acid) Diff of Means P Biochar - Mulch vs. Mulch 13.2 <0.001 Biochar - Mulch vs. Seed Only 13.1 <0.001 Biochar vs. Mulch Biochar vs. Seed Only Biochar - Mulch vs. Biochar Seed Only vs. Mulch
21 Volumetric Water Content(%) greenhouse Comparison (mine) Diff of Means P Biochar vs. Seed Only <0.001 Biochar vs. Mulch <0.001 Biochar - Mulch vs. Seed Only <0.001 Biochar - Mulch vs. Mulch <0.001 Biochar vs. Biochar - Mulch <0.001 Mulch vs. Seed Only Comparison (acid) Diff of Means P Biochar vs. Seed Only <0.001 Biochar vs. Mulch <0.001 Biochar - Mulch vs. Seed Only <0.001 Biochar - Mulch vs. Mulch <0.001 Biochar vs. Biochar - Mulch <0.001 Mulch vs. Seed Only
22


23 Vegetation Cover (%) field


24 Vegetation cover by treatment Vegetation cover by site


25 Biochar + Mulch Biochar
26 Above Ground Biomass(g) greenhouse Comparison (mine) Diff of Means P Bio-Mulch vs. Seed Only 2.22 <0.001 Biochar vs. Seed Only <0.001 Mulch vs. Seed Only 1.48 <0.001 Bio-Mulch vs. Mulch Bio-Mulch vs. Biochar Biochar vs. Mulch Comparison (acid) Diff of Means P Bio-Mulch vs. Seed Only <0.001 Biochar vs. Seed Only <0.001 Mulch vs. Seed Only <0.001 Bio-Mulch vs. Mulch Bio-Mulch vs. Biochar Biochar vs. Mulch 0 1

27
28


29

30


31

32
 -1.9 1 8.1 18.5 26.4 31.9 37.9 37.2 30.3 22 9.5 0.2 18.4 Average Total Precipitation (in.) 1.68 1.75 2.3 1.72 1.46 1.39 2.72 3.1 2.81 2.34 1.49 1.73 24.")
33 Climate statistics for Silverton CO ( ) from Jan Feb Ma r Apr Ma y Jun Jul Aug Sep Oct Nov Dec Annual Average Max. Temperature (F) Average Min. Temperature (F) Average Total Precipitation (in.) June Aug ~8.6 inches


34


35


36
37


38


39
 0.4 0.")
40 BST BRK Mass after drying (g) Treatment


41
42 0.5 Biomass (g) Soil Bio
43 8 7 6 ph Bio10 Bio20 Bio30 Soil

44

45 Kopittke et al 2010


46

47 Colorado Plateau Geosystems, Inc. Contact COLORADO PLATEAU GEOSYSTEMS INC., at