How to improve collection on organic agriculture in the countries of Central and Eastern Europe
|
|
|
- Dayna Weaver
- 5 years ago
- Views:
Transcription

1 Research Institute of Organic Agriculture FiBL How to improve collection on organic agriculture in the countries of Central and Eastern Europe Helga Willer and Julia Lernoud ICOAS 18 Eisenstadt, Austria November 7, 2018
2 About this presentation Organic agriculture in the European Union Organic agriculture in the EU and the CEE countries: area, producers, market Trends Data situation Discussion
3 Introduction: FiBL data collection on organic agriculture: Scope and method Annually, the Research Institute of Organic Agriculture FiBL collects data on key indicators of organic agriculture in European Union such as area, production and trade data among national data sources (for trade data) and Eurostat (for area, production and operator data; Eurostat 2018). Data are compiled in a MySQL database, and quality checks are carried out following the ORMACODE of the EU-funded OrganicDataNetwork (OrganicDataNetwork et al 2014), much of which is based on Eurostat s Statistics Code of Practice (Eurostat 2011). Checks include the comparison against the previous year, the neighbouring countries, and the overall total. In case of inconsistencies, data providers are asked for clarification. FiBL publishes the data annually in collaboration with IFOAM - Organics International in a statistical yearbook (Willer & Lernoud 2018).
4
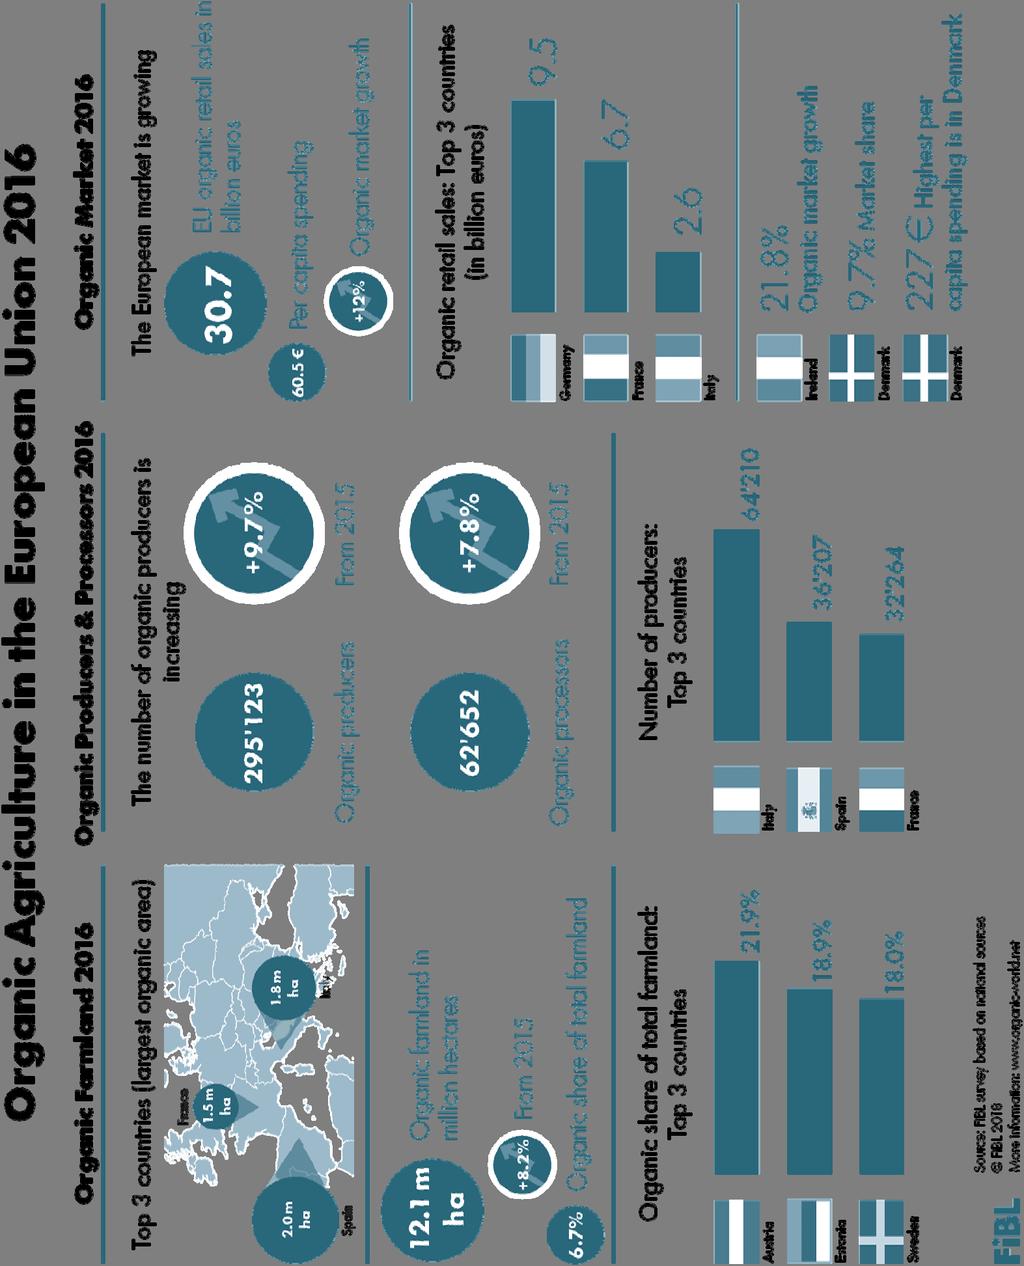
5 Key data 2016 EU CEE countries Area Almost 2.6 million hectares = 21% of the EU s organic farmland (12.1 million hectares) Change 2015/2016: + 5% (EU: +8%). 5.1% of total farmland (EU: 6.7%) Producers Approx (EU: Approx ) Change 2015/2016: + 4% (EU: +10%). Retail sales At least 500 million euros (EU: million Euros).
6 Organic farmland: Top 10 EU countries (total ca. 13 million ha) European Union: The ten countries with the largest organic area Green: EU-CEE countries Source: FiBL-AMI survey 2018, based on national data sources and Eurostat Spain Italy France Germany Austria Sweden (2016) United Kingdom Poland Czech Republic Greece (2016) 620' ' ' ' ' '584 1'373'157 1'744'420 1'908'653 2'082' ' '000' '500' '000' '500'000.0 Hectares
7 Top ten countries organic area shares European Union Countries with organic shares of at least 10 percent Green: EU-CEE countries Source: FiBL survey 2018 Austria Estonia Sweden Italy Latvia Czech Republic Finland Slovakia Denmark Slovenia 10.0% 9.1% 9.0% 11.5% 11.3% 15.4% 14.3% 18.0% 20.5% 23.8% 0% 5% 10% 15% 20% 25% 30% Share of total agricultural land
8 Organic area growth European Union + EU-CEE: Development of organic agricultural land Source: FiBL-AMI survey 2018, based on national data sources and Eurostat Million hectares EU EU: 8.2 % increase EU-CCE: 5.1% EU-CEE
9 Organic area growth EU and EU CEE: Growth rates of organic agricultural land Source: FiBL-AMI survey 2018, based on national data sources and Eurostat 40 EU-28 EU-CEE 30 Growth in %
10 Growh of organic producers EU and EU CEE: Development of organic producers Source: FiBL-AMI surveys based on national data sources and Eurostat 350 In thousands of producers European Union EU-CEE
11 Distribution of retail sales in Europe and worldwide Europe: Distribution of retail sales by country 2016 Source: FiBL-AMI survey 2018 World: distribution of retail sales by single market 2016 Source: FiBL-AMI survey 2018 Sweden 6% Others 10% Germany 28% Netherlands 4% Austria 5% Spain 5% Switzerland Canada 3% 3% China 7% Othe r USA 46% Switzerland 7% UK 7% Italy 8% France 20% EU-28 36%
12 Organic retail sales: Top ten countries Europe: Organic retail sales value by country 2017 Source: FiBL-AMI survey 2018 Germany France Italy Switzerland United Kingdom Sweden Austria Spain Denmark Netherlands 3'137 2'435 2'404 1'874 1'723 1'686 1'602 1'206 7'921 10' '000 4'000 6'000 8'000 10'000 12'000 Million euros
13 Highest organic market shares Europe: The countries with the highest organic shares of the total market Source: FiBL-AMI survey 2018 based on national data sources Denmark Switzerland Austria Sweden Luxembourg Germany Netherlands France Italy Belgium Market share in %
14 EU-CEE: The largest markets for organic food EU-CEE Retail sales for organic food 2017 Source: FiBL-AMI survey 2018 based on national data sources Poland Croatia (2014) Czech Republic (2015) Slovenia (2013) Romania (2016) Hungary (2015) Bulgaria Lithuania (2011) Slovakia (2010) Latvia (2011) Estonia 6 4 4? Retail sales in million euros
15 Development of organic retail sales Development of retail sales Source: FiBL-AMI Surveys , OrganicDataNetwork Surveys Billion euros Europe: 11.4 % increase EU: 12 % increase Europe European Union EU-CEE
16 Europe: Per capita consumption Europe: Per captia consumption 2016 by country group Source: FiBL AMI survey 2018 EFTA 194 EU European Union 61 Europe 41 EU Per capita consumption in euros
17 Distribution area, producers, market 2016 EU and EU CEE: Area distribution Source: FiBL-AMI survey 2018 EU- CEE 20% EU and EU CEE: Producer distribution Source: FiBL-AMI survey 2018 EU- CEE 18% EU and EU CEE: Retail sales distribution Source: FiBL-AMI survey EU CEE 2% Total EU: 12.1 million hectares Total EU producers Total EU: 30.7 billion euros Other EU 80% Other EU 82% Other EU 98%
18 EU CEE trends Strong increase of the organic area in most countries after 2004 Reasons Rural Development programmes Access to the EU market and export opportunities However: Domestic market was not a driver for the strong area growth in the 2000s In the past 2 or 3 years: Market grew stronger than the area (probably); area growth slowed down. 25 November 2018
19 Barriers to market development in the CEE countries Lack of processing infrastructure Processed products are imported and therefore expensive Insufficient cooperation among producers and therefore value chains are often underdeveloped The market can often not be supplied with products in sufficient quality and quantity Due to lack of organisation among producers, fresh products are only available on open markets, which means products are often quite expensive Purchasing power not so high Producer information not as developed as in other EU countries due to lack of information campaigns/action plans
20 Current market trends in the EU CEE countries Currently there are indications that the market is growing faster than in the past due to Increasing purchasing power Better offer of organic products in supermarkets More points of sale Better information of consumers Improved processing facilities, which are is partly supported under the rural development schemes Local supply available due to strong area growth in the past We expect that the market continues to grow and that with a growing market, also the area will grow faster again.
21 Data challenges for total retail sales EU CEE Retail sales for organic food Source: FiBL-AMI survey 2018 Poland Croatia (2014) Czech Republic (2015) Slovenia (2013) Romania (2016) Hungary (2015) Bulgaria Lithuania (2011) Slovakia (2010) Latvia (2011) Estonia ? 235 Only few countries have a permanent collection system Contacts for the activities are missing Data is not regularly updated Data is old in some cases Data is not available at all Data is not complete (e.g. only packaged food) Data is collected with a different methods ranging from guessimates to surveys Often collection method and source is not clear EU CEE data often communicated/collected by external players: USDA, Ekokonnect, Euromonitor Retail sales in millio
22 Market trends? How big is the market really? How much did it grow in the past and does it currently grow? What products do consumers buy? Does the market offer opportunities to market actors, be it producers, importers or exporters? What are the trends? Whereas the availability and accessibility of area and operator data is good, no country, except for the Czech Republic, has a permanent collection system for trade data.
 are collected among retailers and further marketing")
23 Example from the Czech Republic All data are collected under one system, mandated by the Czech Ministry of Agriculture Area, operator, production data are provided to Eurostat Retail sales and export data (including product details) are collected among retailers and further marketing channels
24 Better data on organic markets current gaps in most EU countries Retail volumes/quantities by product are available only for a few countries Retail sales values (EUR) by product are available for many countries, however, in most cases not the total market is covered (e.g. only supermarket sales) Export and import volumes and values by product are, with a few exceptions, virtually non-existent Also total exports and imports are not available for most countries No clear data available on demand at the product level for many countries and not at all on a EU level - Lack of retail sales, import and export volumes means that traceability of products and fraud detection based on data is not possible.
25 Better organic market data what measures? Set up market data collection systems for all countries Include organic market data collection into systems, where similar data are already collected Make governmental support available for private sector activities Harmonize data collection methods and classifications with collection systems in other countries Establish basic quality and plausibility check routines Set up a CEE/European network for organic market data for information exchange and mutual learning
26 Conclusions The data show that, currently, the organic production countries is developing at a slower pace in the EU CEE countries than in the EU as a whole The development of the organic area and production in the past decade (currently slowing down) was not matched by a similar development of the market or processing infrastructure. However, due to the many data gaps, it is not possible to draw a clear picture of the situation. There is a major need to improve data collection particular in the area of market and international trade data.
27 Acknowledgements The work presented here is funded by the Swiss State secretariat for Economic Affairs and the International Trade Centre ITC, and it received funding from the European Union in the framework of the OrganicDataNetwork project (No ), which ran from 2012 to 2014.
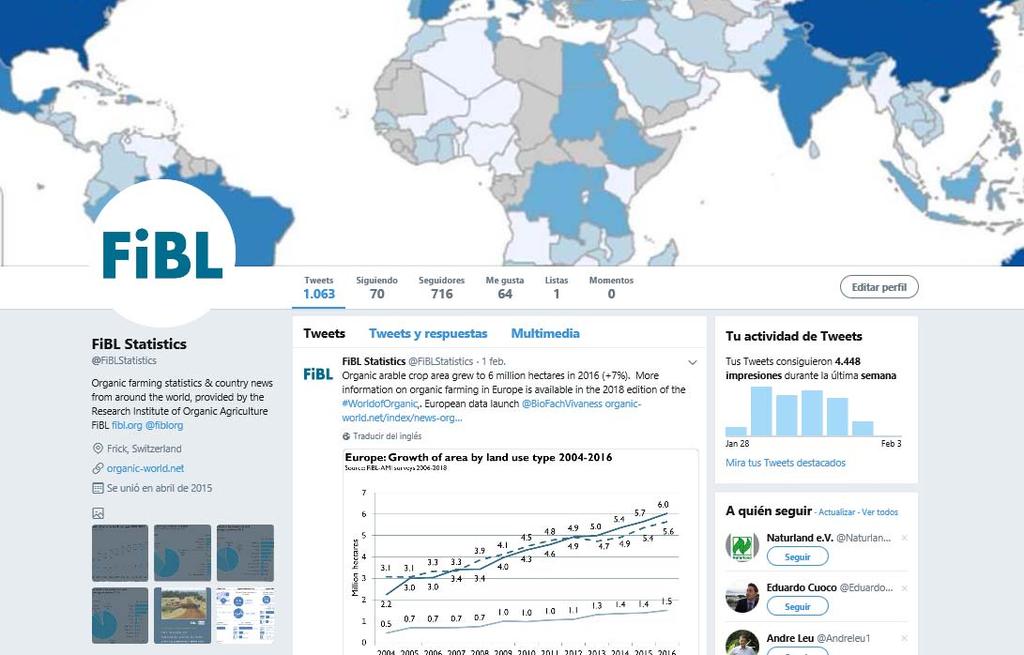
28 Resources «The World of Organic Agriculture» at Slides and infographics at Twitter.com/fiblstatistics Interactive data tables at statistics.fibl.org Interactive maps at Interactive map Organic in Europe at 32

29 The World of Organic Agriculture The 19th edition of The World of Organic Agriculture, was published by FiBL and IFOAM Organics International in February Data tables, country and continent reports Chapter on European production trends Markets, standards, policy support Supported by SECO, ITC, NürnbergMesse and IFOAM Organics International

30 Statistics.FiBL.org
31 Presentations at 35
32 37
33 Contact Helga Willer and Julia Lernoud Research Institute of Organic Agriculture FiBL Ackerstrasse 113 / Postfach Frick Switzerland Phone Fax info.suisse@fibl.org 25 November