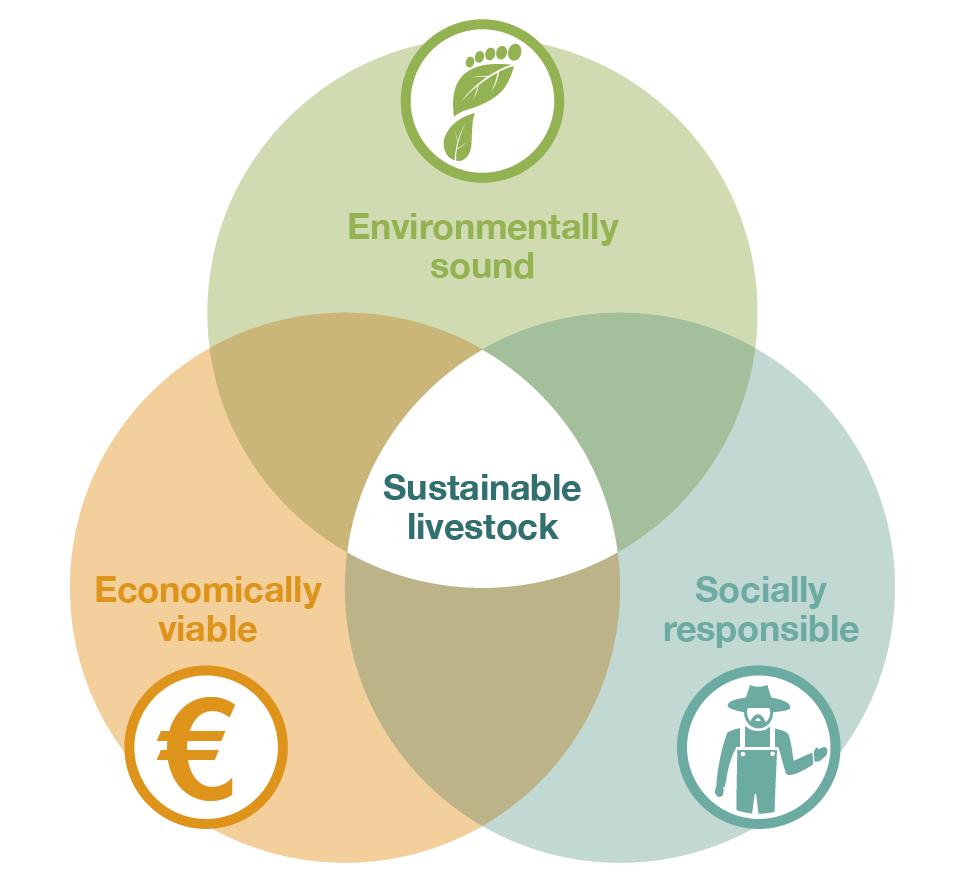
Sustainable dairy farm perspective. A: Sustainable turn over at farm level (resources, money, nitrogen and emission) B: Emission (CF) feed production
|
|
|
- Roxanne Weaver
- 5 years ago
- Views:
Transcription


1 Sustainable dairy farm perspective Troels Kristensen, Aarhus University, Department of Agroecology A: Sustainable turn over at farm level (resources, money, nitrogen and emission) B: Emission (CF) feed production C: Dairy systems effect on product impact D: Dairy farming past, present and future Presentation - Mejeriteknisk selskab, Billund, Januar 2018
2

3 STRATEGI LANDBRUG & FØDEVARER KVÆG

4 Most relevant impact categories for dairy product
5
6 Turn over Danish dairy herd kg milk kg meat (1 cow + 1 heifer) Typical figures, one year. Feed, kg DM ha Economic, dkr Nutrient, kg N ab animal Silage , Grain , Concentrate , Mineral ec. 900 Other cost Emission, kg CO2 eq. Man power Investment Sum Input , Milk Meat Manure (1.500) Emission Surplus

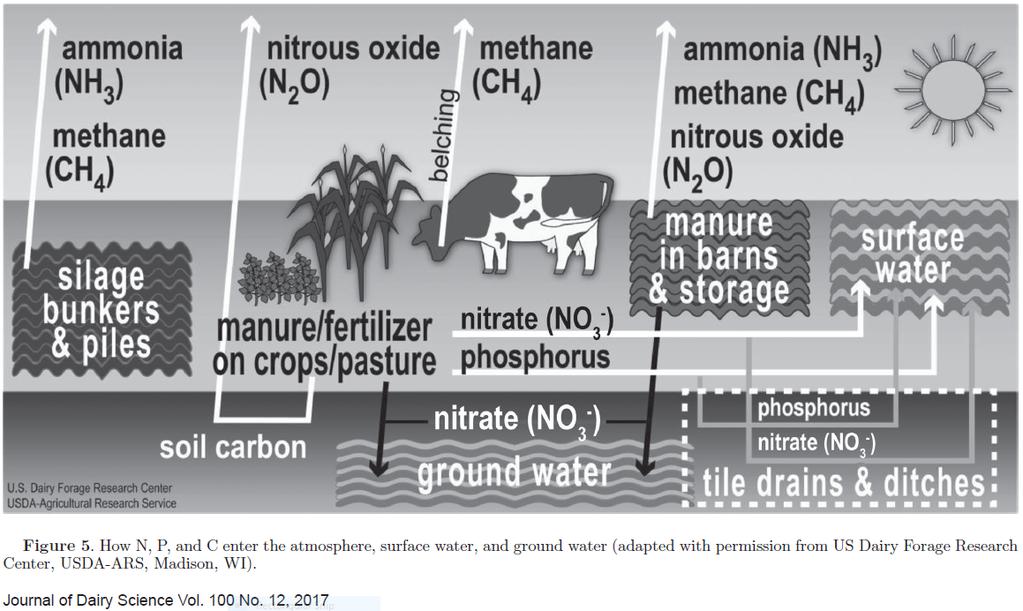
7 Hot spots through Dairy the production chain emissions of USA in the dairy supply products chain climate change The 3 big ones Farm level Consumer level

8 Feed production important areas - Yield - Fertiliser - Energy - Transport - Country
9 Emission of GHG from a range of typical dairy feed stuff PFAD Beet pillets Soy meal Growing Processing Transport Rape cake Maize silage Grass silage Straw Barley CO 2 eq. g / DM
10 Conclusion: Feed production Roughage lower emission than concentrates Biproducts often low emission Dried products high emission Local protein lower than soja imported Some effect of soil carbon on ranking of typical feed stuff Variation low between balanced rations in GHG

11 Variation between intensive Danish dairy farms (n=67)
12 Variation in CF of milk between danish dairy farms % of farms conventional organic ,85 0,9 0,95 1 1,05 1,1 1,15 1,2 1,25 1,3 1,35 CO 2 -eq. per kg ECM Kristensen et al, 2011
13 Variation in CF of milk explained by different farming strategies 40% 27% 17% Farming strategy Herd efficiency Farming intensity N yield crop Grassland Combined milk and meat Not accounted for 4% 5% 7% Kristensen et al, 2011


14 Historic perspective Typical Danish dairy farms 1920 representing local production and marketing 1950 representing the period with emerging mechanization and introduction of new technologies and a more global marked 1980 representing a period with heavily use of external resources like fertilizer and protein 2010 today with focus on balancing production and risk of environmental damage. Kristensen et al / Livest. Sci. (178)
15 Dairy - historical development Key figures typical dairy farms in Denmark Year Yield, kg ECM / cow / year Meat, kg / 1000 kg ECM Fertilizer, kg N / ha Protein, g crude protein / kg DMI Feed efficiency, kg ECM / kg DMI (herd level) Total emission, kg CO 2 eq. Per cow Allocation Per kg ECM Per kg meat Kristensen et al., 2015
16 Herd production in 2040???? Milk recording Holstein in Denmark Milk, kg per cow per year optimistic (170 kg per year) conservative (100 kg / year) realized Optimistic = reality?? - Genomic selection - Feed ration evaluation - Cow specific information - Housing facilities - Health management Kristensen & Weisbjerg, 2015
17 Emission in 2040 different scenarios O: Present (2010) I: Conservative II: Optimist Year III: Optimist + High herd efficiency 1) IV: III + Increased crop production (20%) Yield per cow Efficiency - ECM / DMI (herd) Stocking rate - ECM / ha (farm) CO 2 eq. per kg ECM (no allocation) ) 3 %-units
18 Potential reduction in GHG per kg milk in 2040 compared to 2010 Dairy productivity, beef balance and different technologies manure production technologies biogas genetic feeding crop eff kg ECM beef balance dairy kg ECM Reduction in GHG, % of 2010
19 Summary - CF Environmental impact of dairy products is highly influenced by the farm stage Impact has to be estimated for the whole system dairy farm or sector Danish studies show Productivity increase emission per animal but reduce product emission (25-40% effect) Feed efficiency reduce emission per animal and product (60-80% effect) Herd structure more milk per kg DM reduce product emission (60-70% effect) Additional be aware National Kyoto emission might rank systems different than LCA product emission!!!

20 Thank you for your attention Hristov et al. 2013