Looking Ahead: 2014 Livestock and Grain Economic Outlook
|
|
|
- Ethel Green
- 5 years ago
- Views:
Transcription


1 Looking Ahead: 2014 Livestock and Grain Economic Outlook February 2014 Lee Schulz Assistant Professor & Extension Livestock Economist Department of Economics Iowa State University (515)
2 Key Drivers of Pork Producer Profits What will input prices and production costs be? How many hogs will the market see and how big will they be? Much anticipated USDA Hogs and Pigs Report(s) What do inventories suggest? What do sows farrowing (and intentions) suggest? What do pigs saved per litter suggest? What do pig crops suggest? What will hog slaughter be? What will hog weights be? in 2014 How will pork demand hold up?
3 Input Prices and Production Costs

4 U.S. Corn Supply and Use Data Source: USDA/WAOB, February 10, 2014

5 Data Source: USDA/WAOB, February 10, 2014
6 World Corn Production Data Source: USDA/WAOB, February 10, 2014


7 Feb 2014 WASDE Forecast Data Source: USDA/WAOB, February 10, 2014


8 Data Source: USDA/WAOB, February 10, 2014

9 Data Source: Barchart.com, February 21, 2014

10 Ethanol Operating Margins Ethanol: $1.98/gallon Corn: $4.35/bushel Natural Gas: 6.92/mmBtu Data Source: ISU CARD, February 14, 2014
11 Corn Grind For Ethanol Data Source: Chad Hart, February 17, 2014

12 DDGS, $/ton Corn, $/bu 02/08/2014 $ $ /15/2014 $ $ /22/2014 $ $4.42 DDGS is competitive with corn in hog diets in this range Source: USDA/AMS, February 22, 2014

13 Current Corn Futures Prices Data Source: CME Group, February 21, 2014


14 Data Source: CME Group, February 21, 2014


15 U.S. Soybean Supply and Use Data Source: USDA/WAOB, February 10, 2014

16 2013 = 43.3 bu/acre -1.4% vs Linear (Actual Yield) -2.7% vs Trend -1.7% vs Trend Data Source: USDA/WAOB, February 10, 2014

17 World Soybean Production Data Source: USDA/WAOB, February 10, 2014


18 Feb 2014 WASDE Forecast Data Source: USDA/WAOB, February 10, 2014

19 Data Source: USDA/WAOB, February 10, 2014

20 Data Source: Barchart.com, February 21, 2014

21 Current Soybean Futures Prices Data Source: CME Group, February 21, 2014

22 Data Source: CME Group, February 21, 2014


23 Data Source: CME Group, February 21, 2014


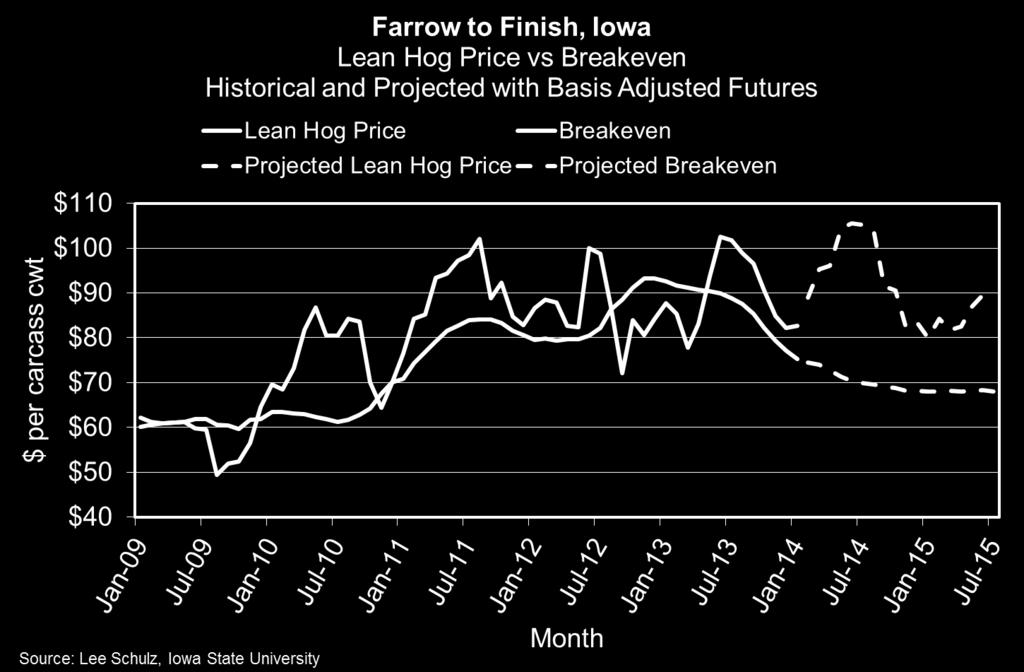
24 Est 2012 Profits = -$3.54 Est 2013 Profits = -$0.89 Forecasted 2014 Profits = +$41.80 Forecasted Jan-July 2015 Profits = +$26.06
25

26 Wheat, Corn, and Soybean Prices Expected to Fall from Recent Highs Wheat, corn, and soybeans in dollars per bushel. Numbers in red denote record levels.

27 Feed Grain Plantings Expected to Fall Reflecting Lower Prices Data Source: USDA/WAOB, February 20, 2014
28 Crop Acreage (million acres) Crop Shifts Corn Soybeans Wheat Hay Other Data Source: USDA/NASS

29 $/acre % Chg Pasture value: $615 $3, % Improved perm pasture: $32 $80 150% Unimproved perm pasture: $23 $51 122% Farmland value: $1,837 $8, %
30 Corn Revenues vs Costs Data Source: USDA/NASS, Compiled & Analysis by Mike Duffy
31 Soybean Prices vs Costs Data Source: USDA/NASS, Compiled & Analysis by Mike Duffy


32 Hogs 8% 5% 6% Cattle 22% 16% 17% Corn 7% 15% 15% Soybeans 6% 10% 10% Data Source: USDA/ERS
33 Hog Supplies

34 Data Source: USDA/NASS
35 Data Source: USDA/NASS
36 Data Source: USDA/NASS
37 Data Source: USDA/NASS
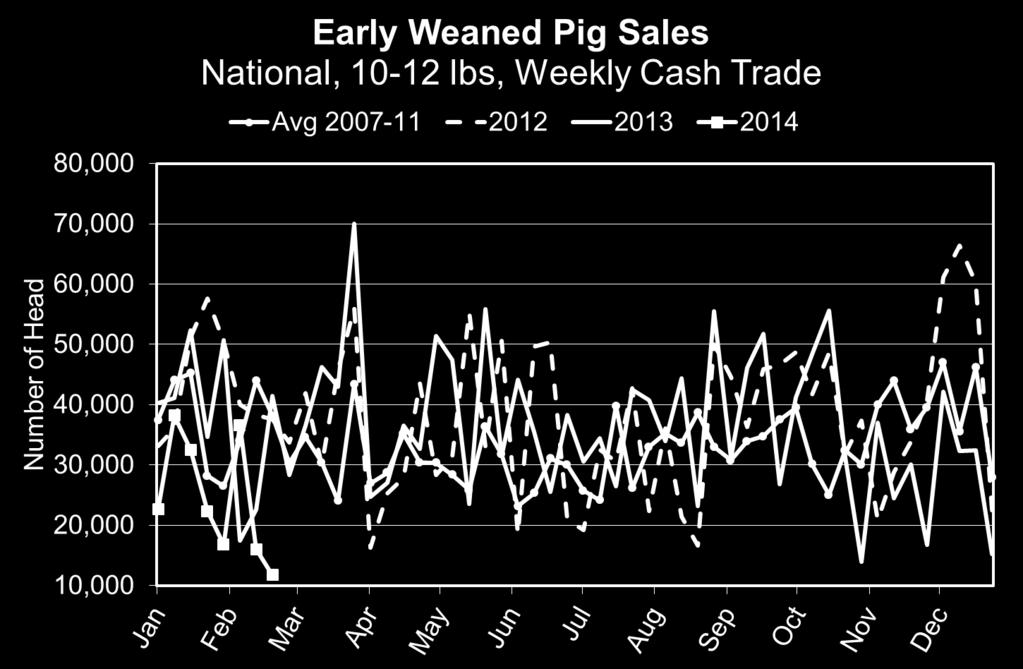
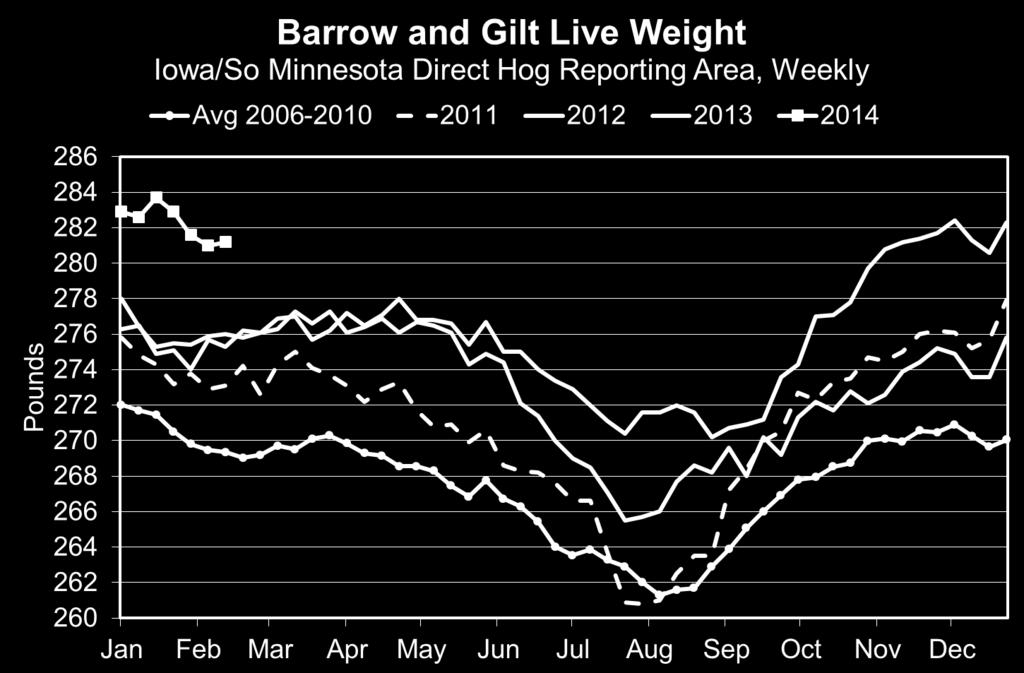
38 2013 Sow Slaughter 2013 Gilt Slaughter* 2014-YTD Gilt Slaughter* -2.9% (vs. 2012) -1.8% (vs. 2012) -3.0% (vs. 2013) -8.9% (vs ) * University of Missouri 2014-YTD Sow Slaughter -5.6% (vs. 2013) -12.6% (vs ) Thou. Head SOW SLAUGHTER Federally Inspected, Weekly Avg JAN APR JUL OCT H-S-15 02/14/ Livestock Marketing Information Center Data Source: USDA-AMS & USDA-NASS
39
40
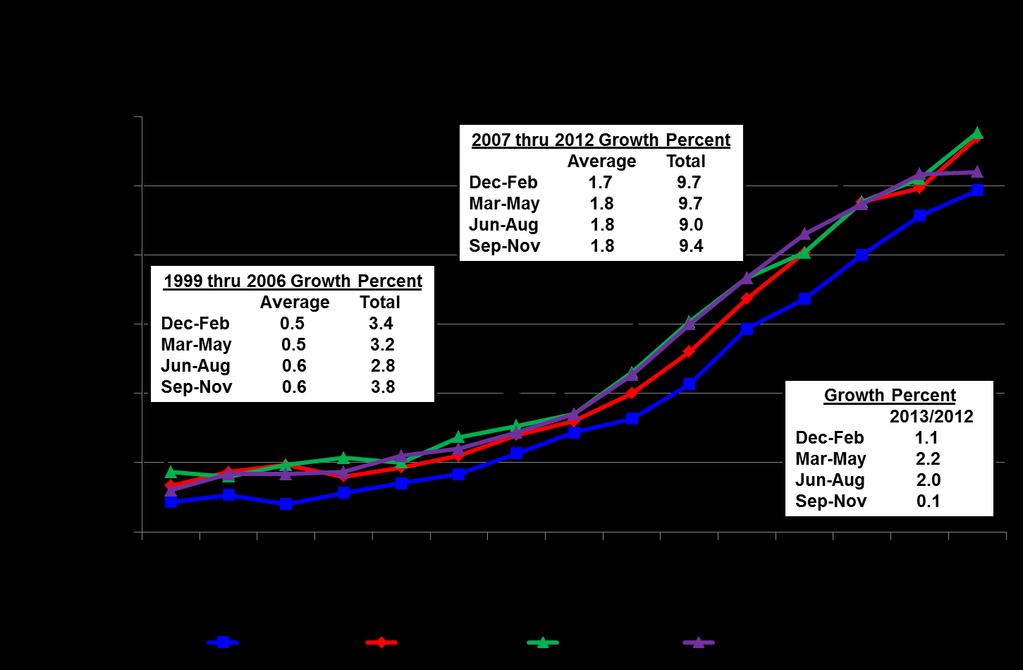
41 Mil. Head Projections Pig % Change Crop From Year Ago Dec-Feb 2013/14 = Farrowing x Commensurate = 28,476 to 28, % to +2.5% Mar-May 2014 = Intentions Pigs per Litter = 29,435 to 30, % to +3.6%???? PIG CROP Quarterly?% to?% Growth % 2013/2012 Dec-Feb 1.1 Mar-May 2.2 Jun-Aug 2.0 Sep-Nov H-N-57 12/27/13 Livestock Marketing Information Center Data Source: USDA-AMS & USDA-NASS

42 Data Source: USDA/AMS

43 Data Source: USDA/AMS

44 Data Source: USDA/AMS

 Data Source:")
45 Incorrect data from APHIS 2014-YTD Feeder Pigs -13.8% (vs. 2013) Data Source: USDA/AMS & APHIS
46 Thou. Head 2,500 2,400 2,300 2,200 2,100 2,000 1,900 HOG SLAUGHTER Federally Inspected, Weekly 2013 Hog Slaughter -1.0% (vs. 2012) 0.1% (vs ) 2014-YTD Hog Slaughter -0.3% (vs. 2013) -2.5% (vs ) Avg ,800 1,700 JAN APR JUL OCT H-S-05 02/14/ Livestock Marketing Information Center Data Source: USDA-AMS & USDA-NASS

47 Data Source: USDA/AMS
48 Mil. Pounds PORK PRODUCTION Federally Inspected, Weekly 2013 Pork Production -0.3% (vs. 2012) 2.2% (vs ) 2014 YTD Pork Production 2.4% (vs. 2013) 1.5% (vs ) Avg JAN APR JUL OCT M-S-19 02/18/14 Livestock Marketing Information Center Data Source: USDA-AMS & USDA-NASS
49 Quarterly Hog & Pork Forecasts (LMIC:02/21/2014) Change Average Change Commercial Change Change Year Commercial from Carcass from Pork from Per Capita from Quarter Slaughter Year Ago Weight Year Ago Production Year Ago Consumption Year Ago (1,000 hd) (%) (lbs) (%) (mil lbs) (%) (retail wt) (%) 2012 I 28, , II 26, , III 27, , IV 30, , Year 113, , I 27, , II 26, , III 27, , IV 29, , Year 112, , I 27, , II 26, , III 27, , IV 30, , Year 112, , I 28, , II 27, , III 28, , IV 31, , Year 115, ,

50 Data Source: USDA/ERS

51 Commercial Production (Year/Year Changes) 2014 = +2.6% 2019 = +0.9% 2015 = +3.2% 2020 = +0.9% 2016 = +1.9% 2021 = +0.8% 2017 = +1.8% 2022 = +0.8% 2018 = +1.1% 2023 = +0.8% Data Source: USDA/ERS
52 Pig and Hog and Pork Prices

53 Data Source: USDA/AMS

54 Data Source: USDA/AMS

55 Data Source: USDA/AMS

56 Data Source: USDA/AMS

57 Data Source: USDA/AMS

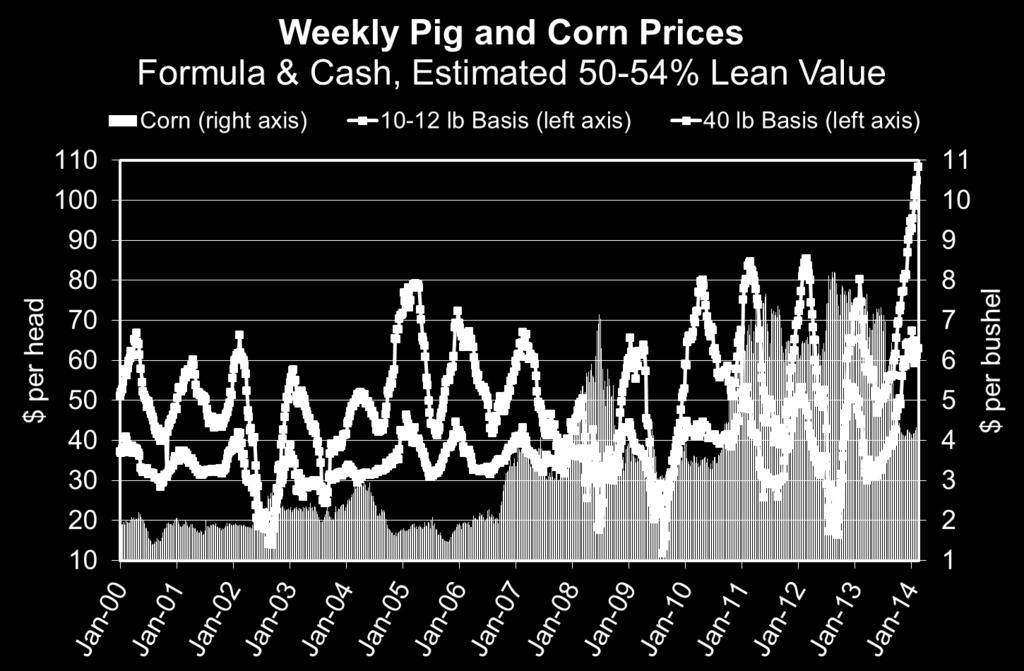
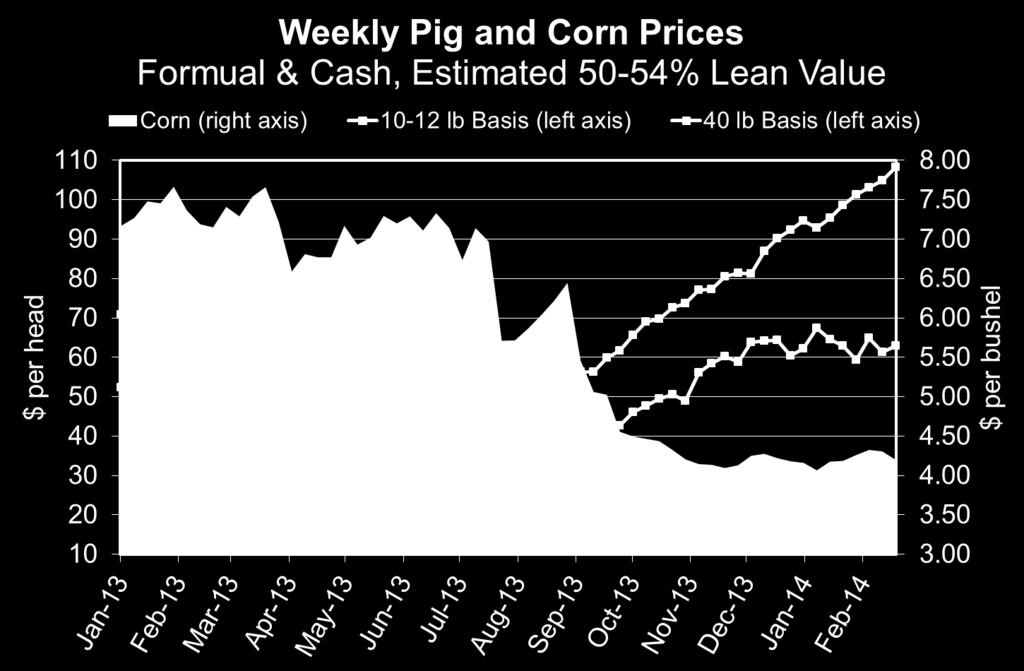
58 Wean to Finish Crush Margin The Crush Margin is the return remaining after accounting for the weaned pig, corn, and soybean meal that is used to cover the other more constant expenses. The Crush Margin is based on the following assumptions: Carcass weight: 200 pounds Pig price: 50% of 5-month out LHF Corn: 10 bu/hd SBM: 150 lbs/hd Data Source: ISU Livestock Crush Margins
59 BARROW AND GILT PRICES Iowa - So. Minnesota, Carcass Base Price, Weekly $ Per Cwt CME (02/21/14) Futures Apr-14 = $ May-14 = $ Jun-14 = $ Jul-14 = $ Aug-14 = $ Oct-14 = $ Dec-14 = $ Avg JAN APR JUL OCT H-P-09 02/10/14 Livestock Marketing Information Center Data Source: USDA-AMS, Compiled & Analysis by LMIC

60 Data Source: CME Group, February 21, 2014
61 Pork Demand

62 Data Source: USDA/ERS

63 Data Source: USDA/ERS, BLS


64 Data Source: USDA/ERS, BLS

65 Pounds per Capita $ per Pound 2013.Q1 +3.1% - 0.2% 2013.Q2 +3.0% +4.0% 2013.Q3 +2.0% +7.4% 2013.Q4 +0.7% +9.2% % +5.1% Data Source: USDA/ERS & USDL/BLS, Compiled & Analysis by Lee Schulz
 $3.")
 Real Prices = +3.6%% IF Real Prices -2.")
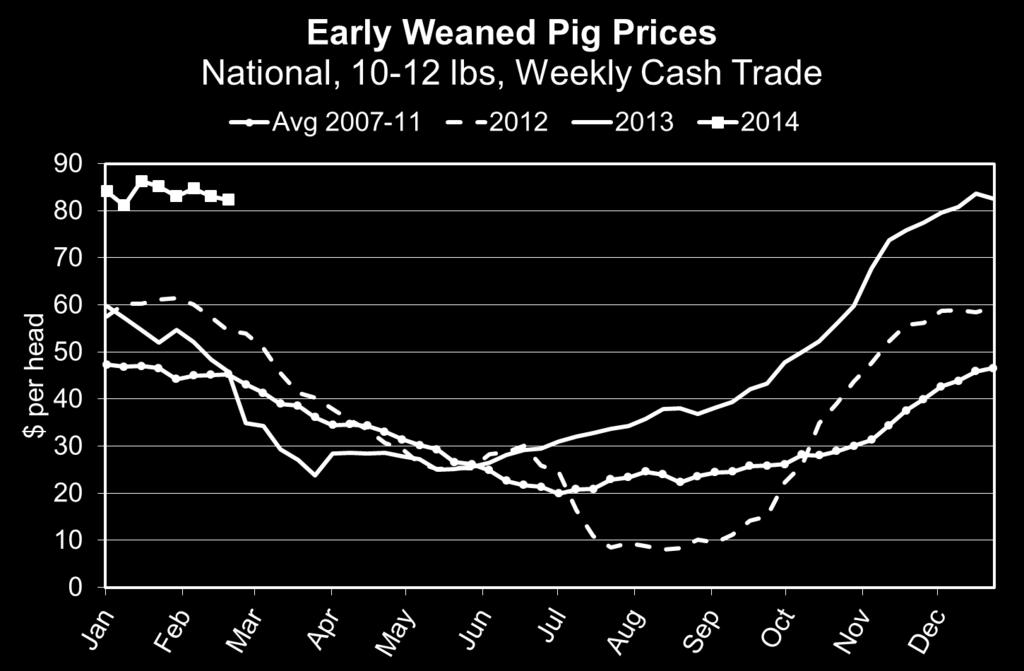
66 Year/Year increases in last 5 quarters (since Q4 of 2012): 2013 = +6.3% Actual Quantity & Price Changes: 2013: 46.9 lbs (per capita consumption) $3.64 (nominal price) $1.56 (real price) 2013: Per Capita Consumption = +2.1% (Year/Year) Real Prices = +3.6%% IF Real Prices -2.6% = 0% Demand Change Data Source: USDA/ERS & USDL/BLS, Compiled & Analysis by Lee Schulz
67 International Trade
68 Bil. Pounds 6.0 U S PORK EXPORTS Carcass Weight, Annual Livestock Marketing Information Center Data Source: USDA-ERS & USDA-FAS, Compiled & Analysis by LMIC I-N-05 02/11/14

69 Data Source: USDA/ERS

70 U.S. Pork Exports, Jan-Dec 2013 Data Source: USDA/ERS
 Data")
71 USDA s Pork Long-Term Trade Projections (as of Feb 2014) Data Source: USDA/ERS


72 Data Source: Policy Analysis Computing & Information Facility In Commerce
 Data")
73 USDA s Pork Long-Term Trade Projections (as of Feb 2014) Data Source: USDA/ERS


74 Data Source: Policy Analysis Computing & Information Facility In Commerce
75 Economic Outlook PEDv Pork production direction is relatively certain Magnitude of impact is relatively uncertain Operation-level impact vs market-level impact Inelastic demand for pigs Contract barns are a sunk cost If no pigs go into the barns payments still made Buying pigs (even at high prices) to fill these barns makes sense for some in the industry Even at a loss

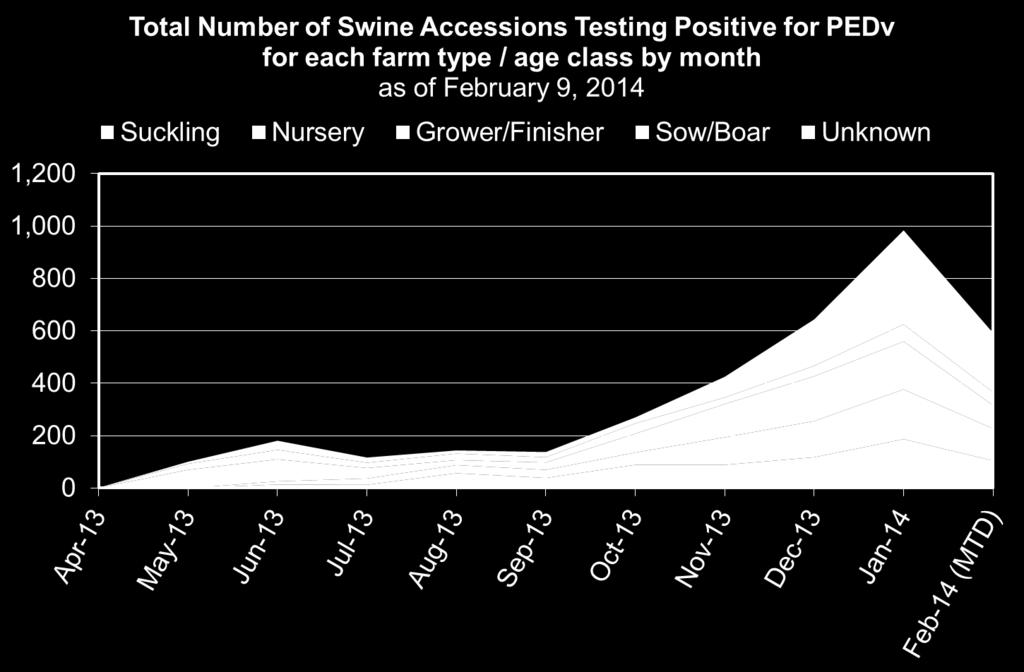
76 Data Source: AASV.org

77 Data Source: AASV.org

78 Wean to Finish Pig Pricing Simulation 50% 5-month out LHF Seller s Buyer s Returns Returns Average $7.31 $3.03 Std Dev $5.68 $16.97 Minimum -$6.39 -$36.67 Maximum $18.91 $35.23


79 Wean to Finish Pig Pricing Simulation 60% 5-month out LHF Seller s Buyer s Returns Returns Average $ $4.78 Std Dev $6.94 $16.11 Minimum -$2.83 -$44.00 Maximum $27.43 $27.56

80 Wean to Finish Pig Pricing Simulation 70% 5-month out LHF Seller s Buyer s Returns Returns Average $ $11.24 Std Dev $6.90 $16.51 Minimum $1.71 -$51.33 Maximum $29.95 $24.74
81 Next months What does this all mean for the pork industry? Profit opportunities should be on the horizon if: Domestic demand can hold Export demand can hold Modest rebound in crop demand and continued moderation in input prices Who will enjoy what share of the profits (producers, packers, retailers) less certain Operation-level impact vs market-level impact of PEDv Strategic opportunities for pork
82 Next 10 years + What does this all mean for the pork industry? Will the industry continue to gain more production capacity? If so, how fast? Don t see large domestic demand changes Projected increased importance of export market Export market fragile be prepared for disruptions The world is diverse with marked variation in preferences (varied importance of price, cut preference, quality, phytosanitary issues, etc.) Changing landscape across production Factors beyond base fundamentals rising in importance Views and comparative advantages will determine the ability to profit and shape the industry Next generation has a hungry and increasingly affluent world population to feed Let s keep up the great work!!!
83 Thank You! More information available at: Iowa Farm Outlook & News Ag Decision Maker ISU Estimated Livestock Returns ISU Livestock Crush Margins