Managing fertilization and irrigation for water quality protection
|
|
|
- Rolf Austin
- 5 years ago
- Views:
Transcription
1 Managing fertilization and irrigation for water quality protection
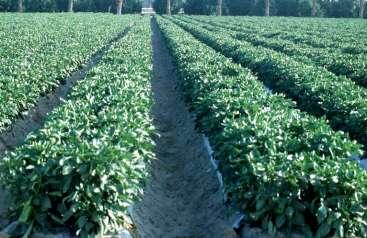
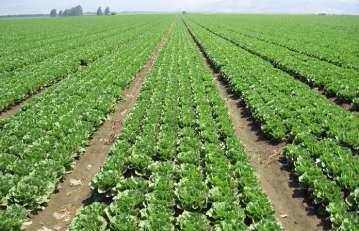
2 Nitrogen budget in coastal vegetable production : lb N / acre Pepper Lettuce Celery Typical seasonal N application Crop uptake Removal in harvest Fertilizer unaccounted for > 150 > 100 > 100 With 2 crops per year the unaccounted for N is very high
3 N budget : Fate of unaccounted for N: - tied up in soil organic N (minimal on an annual basis)
4 N budget : Fate of unaccounted for N: - tied up in soil organic N (minimal on an annual basis) - remain in root zone as NO 3 -N (unlikely with irrigation and winter rain)
5 N budget : Fate of unaccounted for N: - tied up in soil organic N (minimal on an annual basis) - remain in root zone as NO 3 -N (unlikely with irrigation and winter rain) - lost through denitrification (minor loss in most fields)
6 N budget : Fate of unaccounted for N: - tied up in soil organic N (minimal on an annual basis) - remain in root zone as NO 3 -N (unlikely with irrigation and winter rain) - lost through denitrification (minor loss in most fields) - lost through leaching or runoff (the fate of the majority of unaccounted for N)
7 Jan Feb Mar Apr May Jun Jul Aug Sep Oct Nov Dec Jan Soil NO3-N (PPM) Soil NO3-N (lb/acre in top foot) Typical annual cycle of soil NO 3 -N availability : Plant Plant Harvest Harvest Month

8 Environmental standards are very tough : Federal drinking water standard is 10 PPM NO 3 -N

9 How tough is the 10 PPM NO 3 -N standard? An annual leaching loss of 120 lb N / acre would require > 4 feet of annual leaching volume to average 10 PPM NO 3 -N To average 10 PPM NO 3 -N in leachate, soil would need to average < 3 PPM
10 Relationship between soil NO 3 -N and leachate NO 3 -N : all NO 3 -N is in the soil solution, not attached to soil particles soil solution only 20-30% the weight of soil Soil NO 3 -N NO 3 -N in soil solution (PPM) (PPM) Sandy loam Clay

11 drain tile sampling in the Salinas Valley :

12 Bottom line : water leaving vegetable fields will likely exceed 10 PPM NO 3 -N reducing groundwater NO 3 -N loading requires: - reduced fertilizer application, and better timing - improved irrigation efficiency to minimize leaching volume

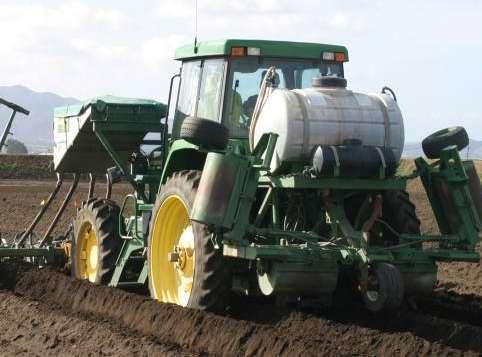
13 More efficient fertilizer use : reduced fertilizer application improve fertilizer timing
14 Percent of fields Reevaluate general crop nitrogen requirements : a lettuce crop contains about lb N/acre at harvest, yet some growers commonly apply much more N < > 250 Seasonal N (kg / ha) survey of 70 commercial lettuce fields :
15 lb N / acre What happens when excess fertilizer is applied? Mean of 11 commercial lettuce trials in which one or more N sidedressings were skipped : Seasonal N application Crop N uptake Grower N Reduced N Conclusion : most excess fertilizer is not even taken up by the plant; it remains in the soil, at risk of leaching
16 Celery N uptake (lb / acre / week) Lettuce N uptake (lb / acre / week) Crop N uptake pattern : lb N/acre at harvest Weeks after planting lb N/acre at harvest Weeks after transplanting
17 Pepper N uptake (lb/acre) Weeks after transplanting lb N/acre seasonal total


18 Lettuce N uptake (lb / acre / week) Limit N application until plants can use it : Weeks after planting

19 Soil NO3-N (lb/acre) Take advantage of residual soil N : Not all crop N uptake comes from fertilizer : > < Percent of lettuce fields survey of commercial lettuce fields, thinning stage

20 Value of Presidedress Soil Nitrate Testing (PSNT) in lettuce production : In 25 commercial lettuce field trials: first sidedressing was skipped in 75% of fields overall N application reduced by > 40% no loss of yield or quality


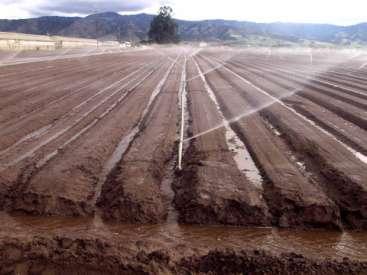
21 Controlling irrigation to limit leachate is critical and drip irrigation is the ideal tool


22 Leaching during stand establishment a particular problem


23 Lettuce irrigation requirement (% of ETo) Irrigation requirement can be predicted by canopy size and ET o : Weeks after planting Efficient seasonal drip irrigation volume % of ET o
24 Jan Feb Mar Apr May Jun Jul Aug Sep Oct Nov Dec Daily evapotranspiration (ETo) Average daily ET o for Morro Bay :
25 % of seasonal ET o applied Irrigation management varies greatly among growers : with drip Ideal zone Commercial field Drip-irrigated lettuce fields in the Salinas Valley
26 % of seasonal ET o applied Consequences of excessive irrigation : with drip Ideal zone Commercial field Assume summer conditions, sandy loam soil : If field 5 applied 5 inches of water with drip, then field 14 applied 10 inches If soil is 10 PPM NO 3 -N, field 14 lost 50 lb N/acre in leaching!
27 2007 lettuce fertigation trials : Field Lettuce type Soil NO 3 -N at start of fertigation (PPM) 1 head 20 2 head 27
 Drip irrigation applied (inches)")
28 2007 lettuce fertigation trials : Field Reference evapotranspiration (ET o, inches) Drip irrigation applied (inches)
29 N fertigation (lb/acre) N fertigation (lb/acre) field lb N fertigated 169 lb N total Days after planting field lb N fertigated 171 lb N total Days after planting
30 N fertigation (lb/acre) N fertigation (lb/acre) Reduced N treatment created by eliminating some N fertigation : x x field 1 50 lb N fertigated 92 lb N total Days after planting x x field 2 46 lb N fertigated 64 lb N total Days after planting
31 Results : lb N / acre Mean plant wt Crop N uptake Field Treatment total fertigated (lb) (lb / acre) 1 Grower Reduced N Grower Reduced N

32 What about winter? Leave as little NO 3 -N in the profile as possible after fall crop Employ winter cover crop where practical


33 Cover crops : - consistently reduce sediment loss - inconsistently reduce nutrient loss
34