Austrian Red Cross Nexus: Water-Energy-Food. Robert Burtscher, Stakeholder Engagement and Liaison
|
|
|
- Damon Robbins
- 5 years ago
- Views:
Transcription


1 Austrian Red Cross Nexus: Water-Energy-Food Robert Burtscher, Stakeholder Engagement and Liaison Vienna,


2 HOME OF IIASA SINCE 1972 IIASA - Energy & Climate Change RESEARCH FOR A CHANGING WORLD Food & Water Poverty & Equity
3 NEXUS THINKING Food/Land Use System - Preparing land - Growing crops ON - Raising livestock - Harvesting produce - Drying, processing - Storing food products - Transport, distribution - Preparing food ENERGY FOOD WATER Energy System - Extracting resources - Harnessing hydro, wind, solar, biomass energy - Generating and transmitting electricity - Production, refinement and distribution of transport fuels - Storing, buffering Hydropower, power plant cooling, extraction, (bio)fuels Water pumping, delivery, water treatment, energy for desalination Water System - Manage renewable surfaceand groundwater resources - Distribute water supply for human consumption - Collect sewage - Treat wastewater to protect human and ecological health - Transfer between basins - Desalination

4 ADC: NEXUS Scheme
 Sector-controlled and sector-driven actions (exploring trade-offs) IIASA 2013, ADA annual meeting")
5 Systemic interrelations between the nexus components Depending on scope of action and on local context: highly systemic (core of nexus) Sector-controlled and sector-driven actions (exploring trade-offs) IIASA 2013, ADA annual meeting (adapted)
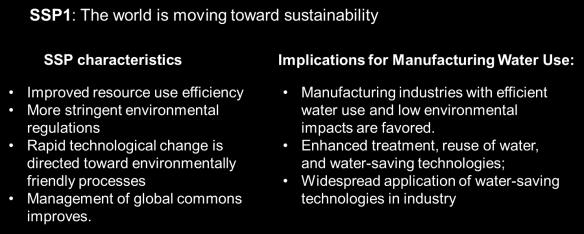
6 Sustainability (Agenda 2030 and beyond) Nexus Sustainability Pathways Today

7 Water Futures and Solutions (WFaS) Initiative Towards Innovative Solutions through Integrative Water Futures Analysis
8 2050 today Surface Water Ground water Re-use Desalination Domestic Agriculture Industry / Energy Eco-systems Surface Water Ground water Re-use Desalination Domestic Agriculture Industry / Energy Eco-systems Available Water Resources Water Demand Solutions Scenarios Use efficiency Solutions Allocation policy Population, Economy, CC, Environment etc.


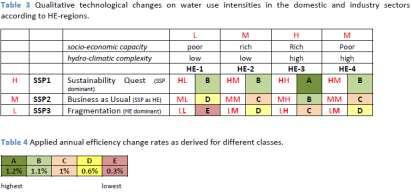

9 Water Futures: Scenarios & Quantitative Assumptions


10 Socio-economic change -Population Lake Victoria basin From 46 Mio. people in 2010 to Mio. people in 2050 (+ 90% - 260% depending on scenario) LVBC Strategy : From 44,9 m people in 2015 to 59.5 m people in 2025
![GDP per capita [US$/year/cap] Socio-economic change - GDP 8000 7000 Lake Victoria basin](/docs-images/92/109899061/images/11-1.jpg "Middle of the Road scenario: 6000 5000 4000 3000 From 1,275 US$/year/cap in 2010 to")
 2000 1000 EAC Vision 2050: 0 2010 2020 2030 2040 2050 GDP(PPP) - Middle of the Road")
11 GDP per capita [US$/year/cap] Socio-economic change - GDP Lake Victoria basin Middle of the Road scenario: From 1,275 US$/year/cap in 2010 to 6,900 US$/year/cap in 2050 (+550%!) EAC Vision 2050: GDP(PPP) - Middle of the Road From 1,014 US$/year/cap in 2014 to 10,000 US$/year/cap in 2050

12 Change in built-up area in EAC
13 Cultivated land [1000 ha] Cultivate land will increase by 30-60% till 2050 for Uganda Cultivate land will increase by 20-40% till 2050 for EAC Cultivated land [1000 ha] Change in cultivated land Cultivated Land Uganda & EAC Uganda_SSP1 Uganda_SSP2 Uganda_SSP Cultivated Land EAC SSP1 EAC SSP2 EAC SSP3


14 Change cultivated land area in EAC
15 Irrigatedl land [1000 ha] Irrigatedl land [1000 ha] Irrigated land will increase by % till 2050 for Uganda Irrigated land will increase by % till 2050 for EAC Change in irrigated land Irrigated land Uganda_SSP1 Uganda_SSP2 Uganda_SSP3 Target based on different strategy documents: Uganda Vision 2040 / National WR Strategy: more than 10 fold (> ha wetland und upland irrigation combined) Irrigated land AMCOW Pan-African M&E System: Increase the size of irrigated areas by 100% from 2000 to Increase water productivity from irrigation and rainfed agriculture by 60% from 2000 to 2025 EAC SSP1 EAC SSP2 EAC SSP3


16 Change irrigated land area in EAC
![Number of people [Million] Potential population exposed to severe water scarcity Global Africa 300 250 200 150 100 50 Water scarce pop.](/docs-images/92/109899061/images/17-1.jpg "- Sustainability Middle of the Road Regional Rivalry 0 2010 2020 2030 2040 2050 Change: in %: 2010: 27% 11% of total population or 105-108 m people 2050: 32%")
17 Number of people [Million] Potential population exposed to severe water scarcity Global Africa Water scarce pop. - Sustainability Middle of the Road Regional Rivalry Change: in %: 2010: 27% 11% of total population or m people 2050: 32% 12% or m people

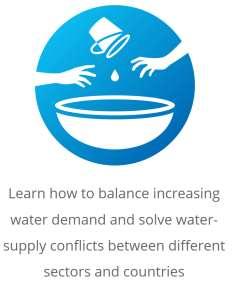
18 Nexus game: opportunity for practicing water management policies players take on the roles of policy makers in two countries that have access to the same river match the increasing water demand with limited supply/resource practicing conflict resolution and cooperation


19 Benefits:
20
21 From science to policy and practice What for do we model hydrological processes and relating them to socio-economic developments and the environment? Building evidence base for solid policy, sustainable water management and investment decisions. Understanding synergies and trade-offs between sectors (users) and riparian countries. water proofing future development pathways and future solution options
22 Interested to engage? Contact: or