6 Analysis and evaluation of the data from the questionnaire with respect to irrigation efficiency
|
|
|
- Dulcie Lawson
- 5 years ago
- Views:
Transcription
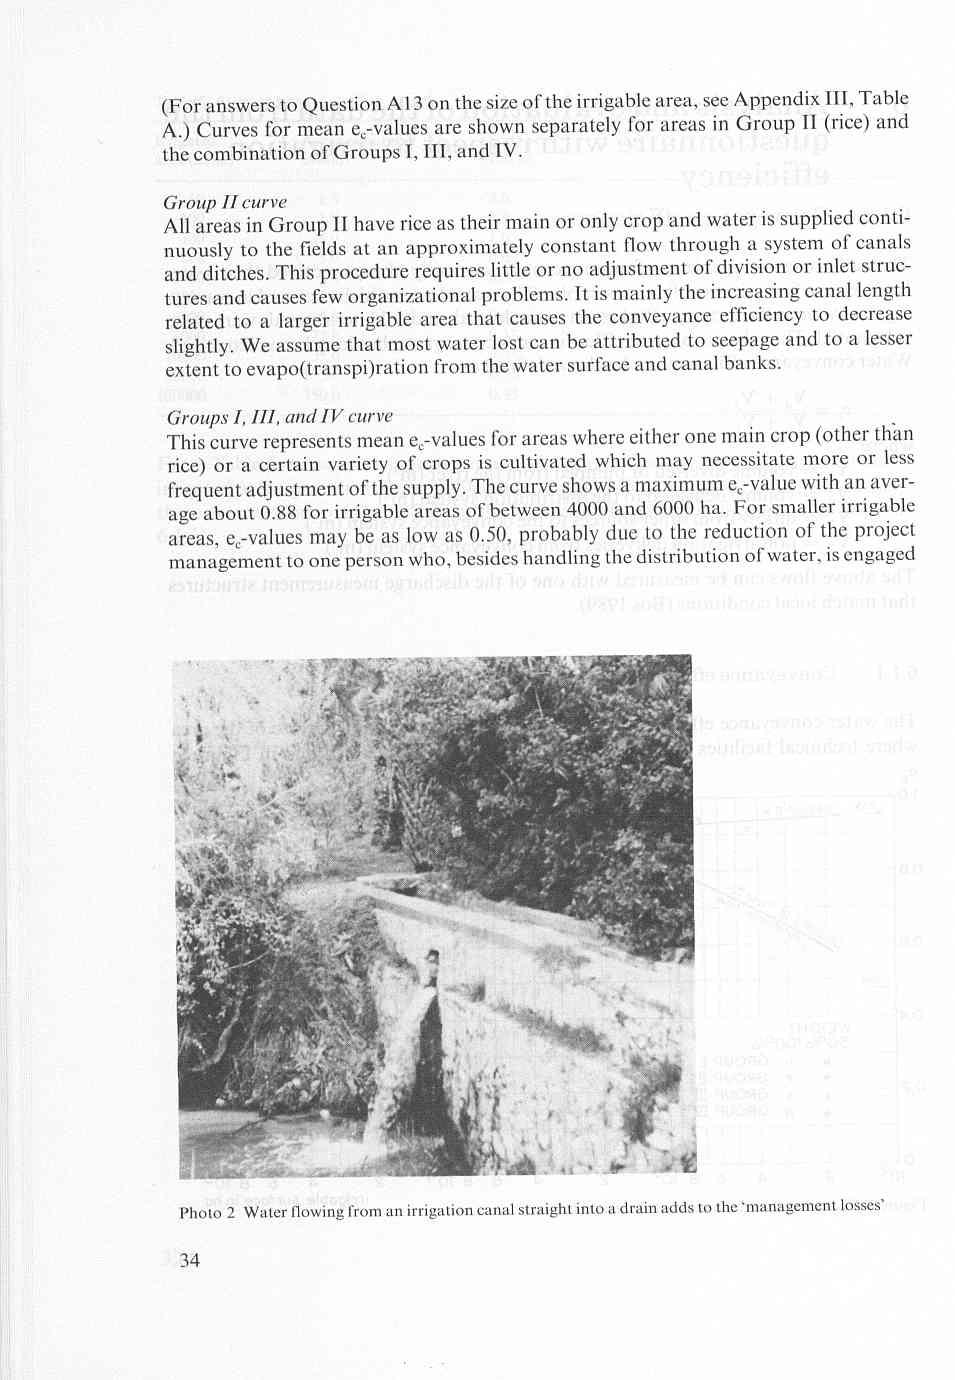
1 6 Analysis and evaluation of the data from the questionnaire with respect to irrigation efficiency 6.1 Conveyance efficiency The early irrigation projects of more recent times nearly always received their water by diversion from rivers or from reservoirs. The water losses which occurred in conveying the water to the tertiary offtakes via main, lateral, and sublateral canals were often substantial. Thus the problem of efficient water conveyance has long been recognized. Water conveyance efficiency, e,, has been defined as where Vd + V? e, = v, + v, V, = volume diverted or pumped from the river (m ) V, = volume delivered to the distribution system (m ) V, = inflow from other sources to the conveyance system (m ) V, = non-irrigation deliveries from conveyance system (m ) The above flows can be measured with one of the discharge measurement structures that match local conditions (Bos 1989) Conveyance efficiency versus average irrigable area The water conveyance efficiency can be considered a function of the size of the area where technical facilities are available for irrigation. This is illustrated in Figure 7.
2
3 in agricultural extension work, maintenance, transport and marketing of crops, administration, etc. If the manager is to fulfill all his tasks satisfactorily, he must be highly skilled, but on small projects (less than 1000 ha) funds are not always available to hire such a person. Also if the irrigable area is large (more than ha), the conveyance efficiency decreases sharply, probably due to the problems management faces in controlling the water supply to remote sub-areas. Large systems tend to be less flexible in adjusting the water supply because of the relatively long time it takes to transmit information on flow rates and water requirements to a central office and the long travel time for water in open canals. To avoid water deficits in downstream canal sections, there is often a tendency to increase the supply to the head of the canal system. Here the importance of a communication system and automatic controls is paramount. In this context it is interesting to note that in the only area (652) of Group I1 that has an e,-value not fitting the mean curve, sweet potatoes, sugar cane, and rice are cultivated and the supply to all these crops is on a schedule of rotational flow. It is also interesting to note that the relevant e,-value corresponds well to the mean curve for irrigable areas in Groups I, 111, and IV. We assume that the difference between the Group I1 curve and the Group I, 111, and IV curve can be mainly attributed to management losses. This water will either be discharged into the drainage system or will inundate non-irrigated lands, creating a drainage problem as a harmful side-effect Conveyance efficiency versus size of rotational unit At the headworks of many irrigation canal systems, water is diverted continuously throughout the irrigation season, its flow rate being adjusted to crop requirements only after periods that are long in relation to the time the water travels through the canal system. Somewhere along the canal system, however, water is drawn continuously via a discharge measuring and regulating structure to serve an irrigation unit with internal rotation to the farms within it. Downstream of such a structure, the canals do not carry water continuously but function on some schedule of intermittent flow. The irrigation unit served by a canal system on intermittent flow is called a rotational unit. Within a rotational unit, the water distribution is organized independently of the overall conveyance and of the water distribution in neighbouring rotational units. It is based only on the farm water requirements in that unit. The size of the rotational unit influences the water conveyance efficiency markedly, as shown in Figure 8 (see Appendix 111, Table B). Figure 8 does not include values for Groups 11 and IV since no irrigation is practised on a rotational schedule in these groups. Figure 8 suggests that an optimum conveyance efficiency can be attained if the size of the rotational unit lies between 70 and 300 ha. If the unit is small (less than 40 ha) the conveyance efficiency decreases sharply because temporary deficiencies of water cannot be eased by managing the already low flow rate on a different schedule. Because of unavoidable inaccuracies in the measurement of the flow rate, a tendency 35
4 o 0.6 A / I O A O., :kik Figure 8 Influence of size of rotational unit on conveyance efficiency (surface irrigation) exists in small rotational units to set a safety margin above the actual amount required. If the rotational unit is large (more than 600 ha), rather long canals of large dimensions have to be filled and emptied after periods which are short in relation to the time the water travels through the canal. Together with the organizational difficulties of correct timing, rotating the flow in large units causes the conveyance efficiency to decrease to values as low as Conveyance efficiency as a function of technical equipment It is obvious that no efficient water conveyance is possible without suitable flow-regulating structures and well-constructed irrigation canals. A comparison of relevant data on 15 areas in Group I and 18 areas in Group I11 is shown in Table 6. Taking into account that the average e,-values shown in Table 6 indicate an order of magnitude rather than absolute values, we cannot conclude that modern structures or modern canal systems by themselves will improve the water conveyance efficiency (see Appendix 111, Table C). The indicative averages of Table 6 point firstly to a generally better conveyance control in Group 111 than in Group I, most probably due to a more efficient use of the system s facilities. It seems to make little difference to the conveyance efficiency whcther the 36
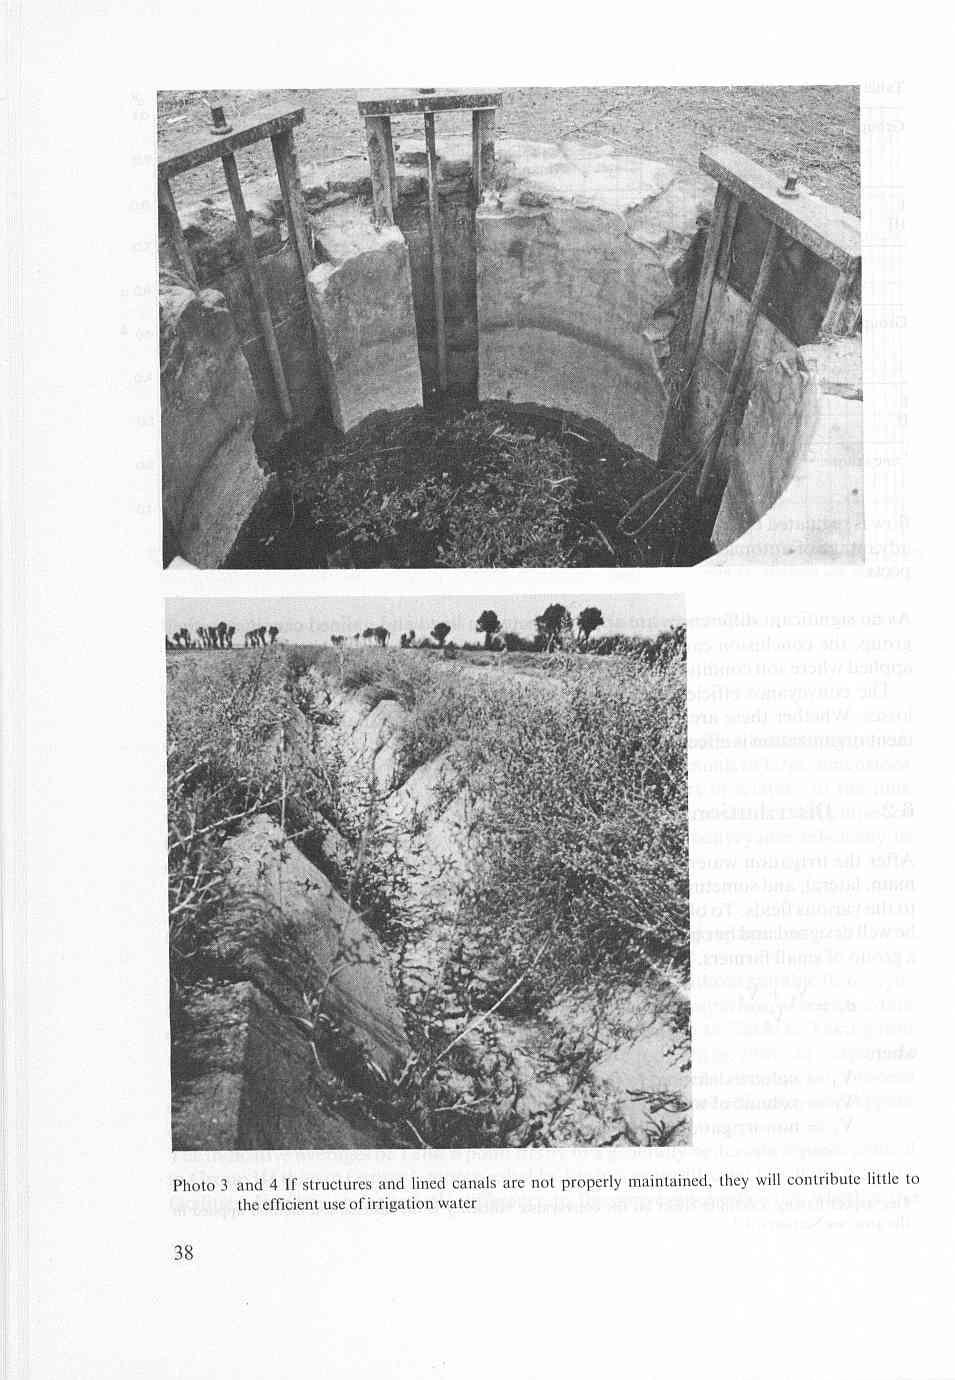
5 .I1 ~ Table 6 e,-values related to flow regulation structures Group No Temp. Fixed Movable Autom. Others Average controls controls struct. gates (manual) devices e, I ' ~.I4.I2.I2.922.I4 e,-values related to lining of conveyance canals Group All canals Main-, lateral- Main- and Main canal All canals lined and sublateral lateral ca- lined earthen canals lined nals lined I.69.56'.62.48'.61 I I9 ~.I3 ' one sample * two samples flow is regulated by fixed structures, hand-operated gates, or automatic controls.' The advantage of automatic controls must mainly be attributed to their labour-saving aspects. As no significant differences are apparent between lined and unlined canals, in either group, the conclusion can be drawn that, at least in the examined areas, linings are applied where soil conditions require the prevention of substantial seepage. The conveyance efficiency depends above all else on the amount of operational losses. Whether these are small or great will largely depend on whether the management organization is effective or not. 6.2 Distribution efficiency After the irrigation water has been conveyed to the farm or group inlet through the main. lateral, and sometimes sub-lateral canals, the subsequent stage is its distribution to the various fields. To obtain a reasonable efficiency the distribution network should be well designed and be operated by skilled farmers or a common irrigator representing a group of small farmers. The distribution efficiency has been defined as where V, = volume delivered to the distribution system (m') VF = volume of water furnished to the fields (m') V, = non-irrigation deliveries from the distributary system (m') ' Onc aspect having a definite cffcct on thc convcyancc cfficicncy is the distribution method applied in the area; sec Section
6
7 Various factors may influence the distribution efficiency as will be explained below Distribution efficiency versus farm size and soil type The distribution efficiency is affected by possible seepage losses from the distributaries, by the method of water distribution, and by the size of the farms which are served by the distribution system. Within certain limits of accuracy the influence of these factors can be read from Figure 9 (for data, see Appendix 111, Tables D and E). Figure 9 suggests that if small farms (less than about 3 ha) are served by a rotational water supply, the e,-value is lower than if large farms, say over 10 ha, are served. The reasons for this are that for small farms the water supply must be adjusted at shorter intervals (accuracy of timing) and that the relatively heavy losses at the beginning and end of each irrigation turn cannot be avoided. If small farms receive their water at a constant rate and it is applied continuously to the field (rice in basin), these operational difficulties do not occur and consequently the distribution efficiency is much higher. If farms have pipelines or lined canals as their distribution system or if farms are situated on less permeable soils (silty clay and clay), the e,-values are above average. ed o farm size in ha Figure 9 The cd AS n function of f,ri m w c niid dommint soil type 39
8

9
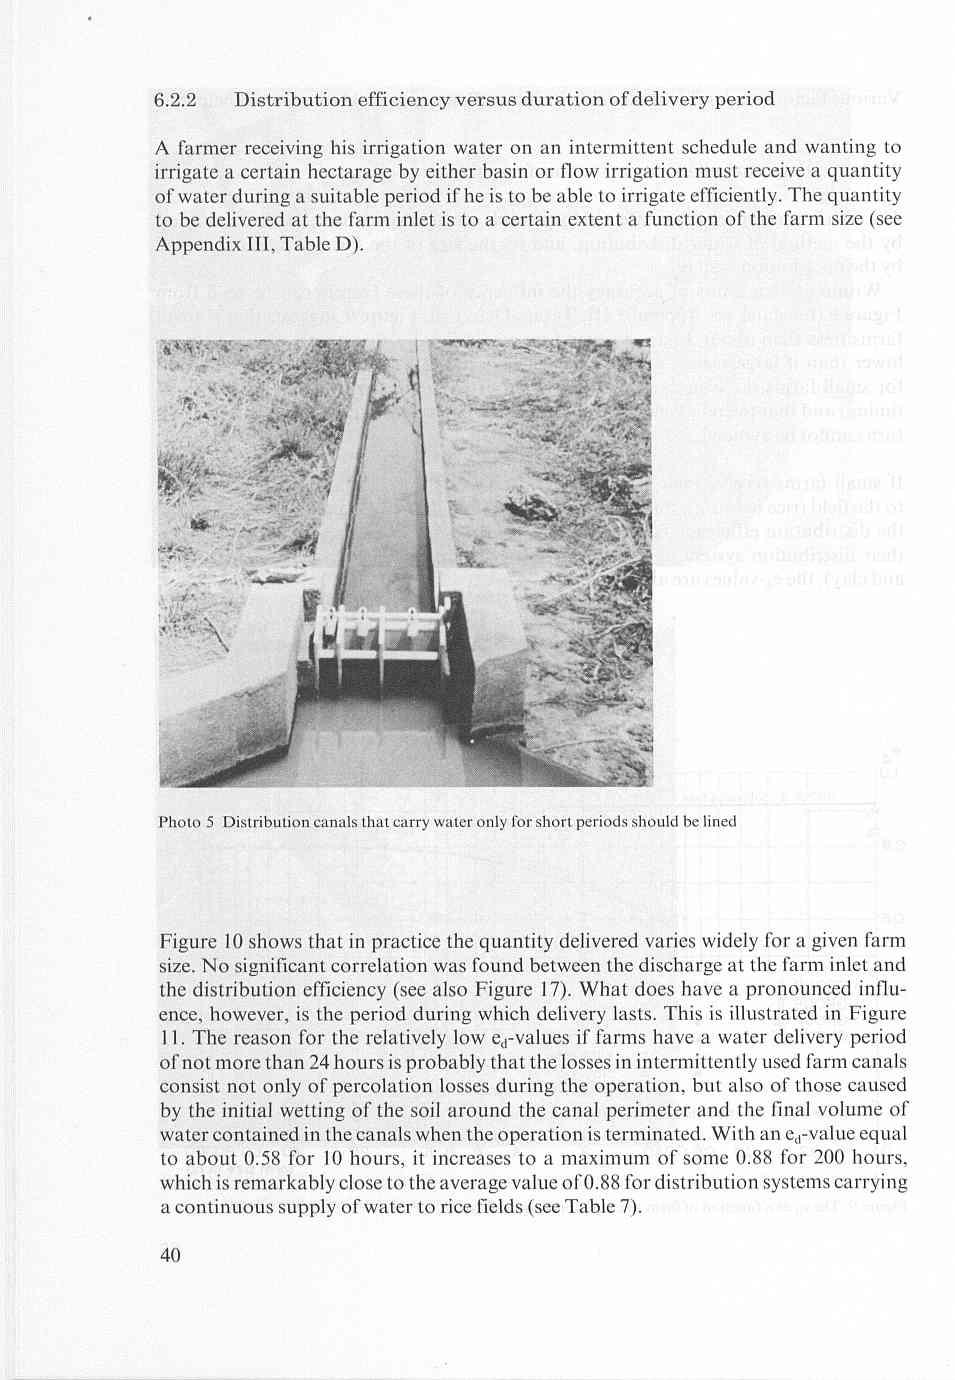
10 hours Figure 11 Influencc of average delivery period at farm inlet on distribution efficiency (surface irrigation) Table 7 Distribution efficiency if farm canals flow continuously (Group 11) Code ed Average [arm size (ha) o I.85 1.o Avcragc.88 To improve the distribution efficiency, we recommend that farm canals be lined, especially those that have a low flow capacity and are used for short periods at a time. 42
11 f Farm inlet versus group inlet The median farm size of Group I is small (2.4 ha) and the usual practice is to deliver water to a group of farms via a group inlet, the individual farms (or farm plots) having no inlet of their own. In Group 111, however, the median farm size is larger (about 20 ha) and many farms have their own inlet. Table 8 illustrates this difference in irrigation practice. It also shows that larger farms, i.e. those having their own inlet from the conveyance system, have a more favourable distribution efficiency than farms without an individual inlet. With these larger farms, the management of the distributary system is easier. Table 8 Type of inlet and its influence on distribution efficiency GROUP I GROUP I1 Code ed Group Farm Code Cd Group Farm inlet inlet inlet inlet I SI2 SI3 514 SIS I so.60 S I.51.6S S so 222.s S s I h KO KO Avcrage Cd value Avcragc.78.6S.82 ed VdlUe 50% weiglit efficiency vtr1uc.y 6.3 Field application efficiency After the water is conveyed through a canal system to the (tertiary) offtake where the farmer (or farmers) distributes the flow to the field inlet, the ultimate goal is to apply it as uniformly as possible over the field, at an application depth which matches the water depletion of the rootzone. The field application efficiency, e,, is defined as vm ea = v,. 43
12 ~ Continuous where V,. = volume of water furnished to the fields (m ) V, = volume of irrigation water needed, and made available, for evapotranspiration by the crop to avoid undesirable water stress in the plants throughout the growing cycle (m3) The field application efficiency quantifies the water application process downstream, of the field inlet. This process often consists of two parts: - The water transport part in the field, e.g. (un)lined head ditch, pipe line, tubes; - The actual application method, e.g. basin, furrows, borders, sprinkler, emitter, etc. Various factors influence e,. Several of them could be derived from the data and are discussed below Influence of field irrigation method on field application efficiency The field irrigation method applied has an important bearing on the field application efficiency. Efficiency values for various application methods are summarized in Table 9. Table 9 Field application efficicncy as a function of irrigation method 4e, per Field application method Average Group ea B, isin. Furrows Borders Sprinkler I I IV Average of groups I, 111 and IV h7 Note: Flooding was excluded from this table since i1 appeared the term flooding was sometimes confused with border strip irrigation and other times with basin irrigation. From the table we may draw the following, rather general, conclusions: -- Provided that topographical conditions are favourable, basin irrigation with intermittent water supply is an efficient method of water application. - Flow irrigation by border strip and furrow has a rather favourable efficiency, considering the inherent non-uniformity of these methods; basin irrigation for rice cultivation (Group 11) has a low application efficiency. This may be attributed mainly to the saturation of the soil profile with its consequent percolation losses, but also to the fact that only vcry rarely is the supply adjusted in accordance with rainfall. It should be noted, however, that a change from continuous to rotational basin irrigation will not necessarily increase 44

13
14 ~ Average FIELD APPLICATION EFFICIENCY e o ml t values for 4-39 irrigotlon projects lexciuding ijce pro~ects) ~verage vaiue for 16 rice pro, - BORDER STRIP FIELD IRRIGATION PRINKLE METHOD Figure 12 Field application efficiency related to irrigalion methods field application efficiency efl O O Figure I3 Field application efficiency and incthod with reference to soil type 46
15 Intermittent basin irrigation shows a rather constant application efficiency of 0.58 for all soils, which can be explained by the presence of the almost stagnant water layer over the field during infiltration. With this method the application efficiency seems to depend entirely on the uniformity with which the depth of water is applied. A horizontal basin floor and refined land levelling can contribute much to the efficiency. With regard to flow irrigation efficiency, Figure 13 would seem to indicate that the irrigation of light soils is handled somewhat more efficiently than that of heavy soils. This is in contrast to the general assumption, referred to above, that flow irrigation is more efficient on heavy soils. If the indicated trend is realistic, the conclusion could be that the special problems of flow irrigation on light soils are wel1 understood and that the field systems are adapted to them: by operating short lengths of run, for instance. Figure 13 further indicates that (heavy) clay soils are less suitable for sprinkler irrigation, probably due to the low infiltration rate and its sharp reduction with time. If the sprinklers do not have a particularly low intensity, water will be partially ponded on the surface, or, if the land is sloping, surface runoff will occur. Basin irrigation with a continuous water supply has a reasonably good application efficiency on heavy soils. The average values shown in this figure are based upon data from 26 areas with flow irrigation, 18 areas with intermittent basin irrigation, 12 areas with sprinkler irrigation, and 15 areas with a continuous water supply to basins. (For detailed data, see Appendix I11.) Effect of depth of application on e, The purpose of an irrigation turn is to provide water that can be stored within the rootzone of the crop so that the plants can draw on this water during the period between successive irrigations. In accordance with good irrigation practice, the depth of water applied per irrigation is mainly a function of root depth and the moisture storage capacity of the soil. Figure 14 indicates that the depth of water applied by surface irrigation methods (as against overhead sprinkler methods) has no marked influence on e, provided that at least 60 mm is applied. If less water is applied, the technical limitations of surface application methods are such that no uniform water distribution can be achieved, resulting in a low field application efficiency. Overhead sprinkler irrigation can supply a limited depth of water rather uniformly. As shown in Figure 14 sprinkler irrigation is especially suited to supply amounts of less than 60 mm, which can be advantageous for crops with a shallow rootzone. 41
16 depth per irrigation turn in mm Figure 14 Relation of field application efficiency to depth of application per irrigation Field application efficiency versus farm size and soil type Figure 15 shows that no correlation was found between farm size and the efficiency with which water is applied to the fields. Nor does the type of soil on which the farm is situated seem to have any independent influence on the field application efficiency. Figure 15 Relation of field application efficiency to [arm sirc and dominant soil type 48
17 P Influence of farm flow rate on application efficiency Figure 10 illustrated that farmers utilize a wide range of flow rate to irrigate the same size of farm. By itself, the available flow rate at the farm inlet has no influence on the field application efficiency (see also Figure 17), but it is one of the factors that decides the size of the farm plot that can be irrigated at one time. The flow (I/s) utilized to irrigate a unit surface (ha) farm plot at one time, however, appears to influence the field application efficiency as illustrated in Figure 16. The surface irrigation data of Groups I and TI1 reveal favourable application efficiencies for flows of 30 to 50 l/s per ha plot. If the flow rate at the farm inlet is known, it is possible to determine the size of the farm plot that can be irrigated at one time with a favourable application efficiency. (From this, one can calculate the number of plots per farm.) In reverse, if the plot size is fixed, Figure 16 can be used to select a suitable flow rate at the farm inlet. 49