ARC/PLC Program Overview
|
|
|
- Tracy Fletcher
- 5 years ago
- Views:
Transcription


1 ARC/PLC Program Overview FSA and University of MN Extension Producer Meetings December 2014 January 2015
2 The 2014 Farm Bill provides the following: Eliminates DCP and ACRE program Allows for a one-time decision REALLOCATE base acres and/or UPDATE Counter-Cyclical Yields on a farm
3 Two NEW Programs ARC: Agriculture Risk Coverage (Revenue Based) Two Options: ARC-CO County Level Coverage ARC-IC Individual Level Coverage PLC: Price Loss Coverage (Price Based)
4 Covered Commodities for ARC/PLC Barley Canola Corn Crambe Flaxseed Garbanzo, Large Garbanzo, Small Grain Sorghum Lentils Mustard Seed Oats Peanuts Peas, Dry Rapeseed Rice, Long Grain Rice, Medium Grain Safflowers Sesame Seed Soybeans Sunflower Seed Wheat
5 ARC/PLC Program Process has three PARTS: 1. Update: Owners can Reallocate Base acres and/or update Counter-Cyclical Yields 2. Election: Once Base Acres and Yields are set, then the Election of PLC, ARC-CO or ARC-IC can be completed. 3. Enrollment: Once Election has been completed then Enrollment takes place.
6 Update Process: Reallocate Base acres and/or Update Yield process Started September 29, 2014 Ends February 27, 2015
7 The first week of August, ALL owners and operators received the following: 1. Letter provides basic background information on base acreage Reallocation and Update of Yield options. 2. Summary Acreage History Report : Acreage of covered commodities reported to FSA, per FSA FARM. Current year Base Acres & CC Yields. NOTE: Only Current farms with base acres received letters with the history reports
8 The Summary Acreage History Report may show Blanks in one or more of the years, 2008 through If a current FSA Tract # was changed (tract division, combination, farm transfer) in a year 2009 through 2014, our acreage reporting system could not identify the covered commodities reported. County Offices have been researching the acreage history to identify the missing covered commodities reported. In Minnesota, once the County Office completes the research, an updated letter is sent to operators with the corrected acreage history for the farm,
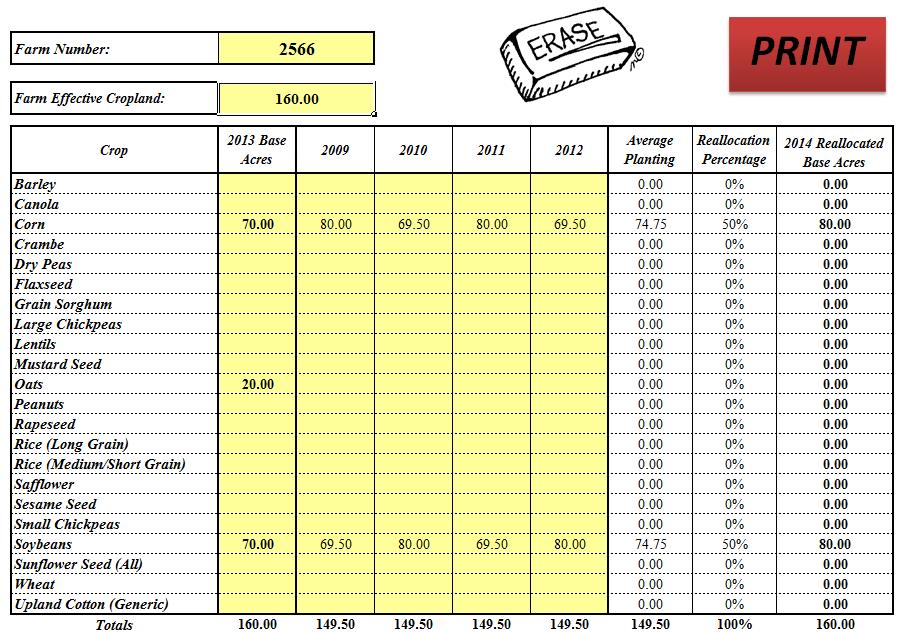
9 Update Process: BASE OPTIONS 1. Retain Current Year Base Acres OR 2. Reallocate Base Acres (cannot increase TOTAL) Planting History of covered commodities, 2009 through 2012 Note: This option is available to owners on farms regardless of program election: PLC/ARC-CO/ARC-IC
10 Farm #2566 Cropland: Corn Base: Soybean Base: Oats Base: acres 70.0 acres 70.0 acres 20.0 acres CROP HISTORY CROP Corn Soybeans
11
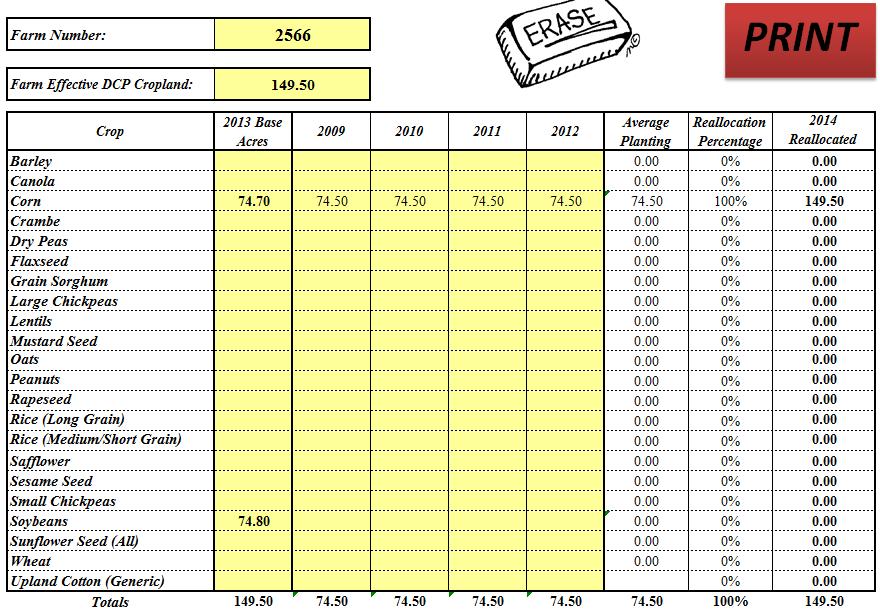
12 Farm #2566 Cropland: Corn Base: Soybean Base: acres 74.7 acres 74.8 acres CROP HISTORY CROP Corn Alfalfa (Not a Covered Commodity)
13
14 Update Process: YIELD OPTIONS 1. Retain Current Counter-Cyclical Yields OR 2. Update Yields: Covered Commodities: (simple average of years planted X 90%) A Substitute Yield is available under two circumstances explained later. Note: This option is available PER Crop AND available to owners and farms regardless of program election: PLC/ARC-CO/ARC-IC
15 Update Yields (continued) Substitute Yield definition: 75% of the 2008 through 2012 simple county average yield per planted acre for the covered commodity Note: County Substitute Yields by crop have been posted to the ARCPLC website:
16 Update Yields (continued) Substitute yields can be used when: 1. Farm s yield is below the substitute yield in any year, 2008 through 2012 OR 2. The crop was planted in a year and the owner does not have yield records available.
17 Update Yields (continued) Operators or owners can provide Yields for the years the crop was planted on the farm, 2008 through 2012 Yields are Certified to the County Office at the FARM level County Offices are NOT accepting production records and/or calculating yields for producers Upon certifying yields, the OWNER makes the decision on whether to update.
18 Update Yields (continued) Certified Yields are subject to spot-check and the owner will be responsible for providing the records to verify the accuracy of the yields. Acceptable records for a spot-check would include: RMA data, specific year yields used in APH records Production Evidence, sold or commercial storage On-Farm storage records FSA Loan Records
19 Update Yields (continued) Once the decision is made to Retain or Update the yield(s) on the farm the new yield becomes the PLC Yield for the farm.
20 5 Year average of Planted acreage Farm #1 Crop Corn Current Corn Yield: 142/bu Total Avg. Yield PLC Yield (90%) Avg. CO Yield (75%) /bu
 175 185 176 658 165 148/bu. Avg.")
21 Farm #2 Crop Corn 4 Year Average of Planted acres Current Corn Yield: 132/bu Total Avg. Yield Zero Plant Planted No Evidence PLC Yield (90%) /bu. Avg. CO Yield (75%)
22 Update Decision (Base & Yield): A current OWNER makes the update decision: Reallocate or Retain Base Acres Update or Retain Yields
23 If any current owner submits a conflicting Reallocation/Yield Update request: No reallocation/yield update will be approved for the farm until, ALL current owners provide County Committee written evidence the dispute has been resolved during the reallocation period If NO decision is made during the Reallocation/Yield update period: Farm will retain the Current Base Acres and Yields associated with the farm
24 Election Process: Once Base Acres and Yields are set, then the Election of PLC or ARC can be completed. Starts November 17, 2014 Ends March 31, 2015
25 Authorizes a one-time, 5-YEAR ELECTION of programs: Price Loss Coverage (PLC) offers price protection Ag Risk Coverage-County (ARC-CO) offers revenue protection at the COUNTY level Ag Risk Coverage-Individual (ARC-IC) offers revenue protection at an individual farm level across all farms enrolled and covered commodities planted in a State.
26 If ARC-CO or PLC is elected on a Farm: Election on a covered commodity by covered commodity basis NOTE: RMA s SCO is an option for crops with PLC selected If ARC-IC is selected on a Farm: ALL covered commodities planted on the farm are ARC- IC crops. PLC is NOT an option for the farm ARC-CO is NOT an option for the farm
27 Current Producers make the Election of PLC, ARC-CO or ARC-IC on each FSA Farm Number: a. Current producers with an interest in cropland on the farm will make the one-time irrevocable election. b. Failure to make an election by the deadline will result in PLC election starting in 2015 through 2018 and NO payments for 2014.
28 Current Producer: Means the person or legal entity meeting the definition of producer on the day that person or legal entity is signing any form or performing any action required for the election process.
29 Definition of a producer: A person or legal entity with a share in a crop on cropland on the farm and shares in the risk of producing the crop on the farm. NOTE: Cash Rent Owners do not have a share in the crop nor does the owner share in the risk of producing the crop
30 Payments made when effective price is less than the reference price for a covered commodity. Effective Price is the higher of Marketing year Average Price (MYA) for the crop or the National Loan Rate for the crop Payments made on 85% of base acres of the covered commodity Payments are made regardless of the planting of the covered commodity. NOTE: The reference price & national loan rate for each crop was set by statute and remains the same for all years of the farm bill.
31 The Reference Price & National Loan Rate remains the same for the life of the 2014 farm bill: Crop Reference Price National Loan Rate Max PLC Rate Barley $4.95 $1.95 $3.00 Corn $3.70 $1.95 $1.75 Oats $2.40 $1.39 $1.00 Soybeans $8.40 $5.00 $3.40 Wheat $5.50 $2.94 $2.56 Grain Sorghum $3.95 $1.95 $2.00
 for corn is $3.50/bu., the PLC payment rate would be $0.20/bu.")
32 Farm #1: Corn Base: 100 acres PLC Yield: 142/bu. Soybean Base: 50 acres PLC Yield: 45/bu. Reference price for Corn is $3.70/bu. Reference price for Soybeans is $8.40/bu. The Corn loan rate is $1.95/bu. The Soybean loan rate is $5.00/bu. If the marketing year average price (hypothetical) for corn is $3.50/bu., the PLC payment rate would be $0.20/bu. ($ $3.50).
33 The payment computation for this corn example would be: Corn base: 100 acres X 85% X $0.20/bu. X 142/bu. = $ If the marketing year average price (hypothetical) for soybeans is $8.50/bu., the PLC payment rate would be $0.00/bu. ($ $8.50) as the MYA exceeds the reference price.
34 Payments made when the ARC-CO Actual Revenue is less than the ARC-CO Guarantee (86% Benchmark Revenue) for a covered commodity. County Yield data is used, not individual farm data The payment rate can be no higher than 10% of the ARC-CO Benchmark Revenue for the covered commodity Payments made on 85% of base acres of the covered commodity Payments are made regardless of the planting of the covered commodity.
35 ARC-CO Benchmark Revenue calculated by multiplying: 5 Year Olympic Average Yield: higher of: County Yield for the crop, or 70% of the county transitional yield (70%T) (Times) 5 Year Olympic Average Price: higher of: Market Year Average (MYA) price, or Reference Price for the covered commodity.
36 ARC-CO Actual Year Revenue calculated by multiplying: Actual Average County Yield for the covered commodity (Times) Higher of: Marketing Year Average (MYA) price, or National Loan Rate for the covered commodity.
37 ARC-CO Example with one base crop on one farm: Farm #1: Corn Base: 100 acres PLC Yield: 142/bu. ARC-CO Payment rate cannot EXCEED 10% of the ARC-CO Benchmark Revenue for Corn. Payments are made on 85% of base acres of the covered commodity. NOTE: Each County will have a different ARC-CO calculation by crop since the county yield is used in the calculation
38 Step 1: Corn ARC-CO Benchmark Revenue Calculation (County Data): Benchmark Yield = 5 year Olympic Average (166) Benchmark Price = 5 year Olympic Average ($5.29) CORN Yield % of T- Yield MYA Price $3.55 $5.18 $6.22 $6.89 $4.46 Reference Price $3.70 $3.70 $3.70 $3.70 $3.70
39 Corn ARC-CO Benchmark Revenue Calculation: Benchmark Yield = 166/bu. Benchmark Price = $5.29 Benchmark Revenue = $ (166 X $5.29) Step 2: Corn ARC-CO Guarantee Calculation: Benchmark Revenue ($878.14) X 86% = $755.20
40 Step 3: Corn ARC-CO Actual Revenue: Corn ARC-CO Actual Revenue Calculation: (160/bu. X $3.50 = $560.00) NOTE: Use higher of MYA price or National Loan Rate CROP 2014 CO Actual Yield (projected) 2014 MYA Price (projected) National Loan Rate Actual Revenue (projected) CORN 160 $3.50 $1.95 $560.00
41 Step 4: ARC-CO Revenue Calculation: Corn ARC-CO: Guarantee $ Actual Revenue $ Revenue Loss $ Note: Maximum Payment Rate (cap) would be $87.81 ( X 10%) Step 5: Payment computation for this example would be: Corn base 100 acres X 85% X $87.81 (cap) = $7464
42 Payments are made when the ARC-IC Actual Revenue is less than the ARC-IC Guarantee (86% Benchmark) for ALL covered commodities on ALL farms enrolled in ARC- IC in the state for the producer. The payment rate is the difference in the ARC-IC Guarantee and the ARC-IC Actual Revenue, but can be no higher than 10% of the ARC-IC Benchmark Revenue for all covered commodities on the farm Payments made on 65% of base acres of all covered commodities on the farm.
43 ARC-IC Requires: Election & Enrollment where only enrolled farms each year are included in ARC-IC revenue calculations Planting of covered commodities that will be used to calculate Revenues across ALL covered commodities planted Production reports of covered commodities.
44 ARC-IC benchmarks, guarantees and actual revenues are calculated at the farm level and WEIGHTED to the producer s share of the covered commodities planted across ALL enrolled ARC-IC farm(s) in the state. ARC-IC Benchmark Revenues: 5 Year Olympic Average of the revenues
45 The ARC-IC farm consists of all farms enrolled in ARC-IC within the state for the producer. The ARC-IC Revenues are calculated across ALL covered commodities planted on ALL farms enrolled in ARC-IC: EXAMPLE Farm # 1 (one farm enrolled in ARC-IC) Corn Base: 100 acres Soybean Base: 50 acres 2014 Planted Acres: Corn: 110 acres Soybeans: 50 acres Producer share is 100% of both crops planted
46 Step 1: Percentage of covered commodities planted for each crop is the P&CP acres divided by the total acres of covered commodities on the ARC-IC farm: CROP PLANTED ACRES % Of Covered Commodity Planted Calculations Corn % (110 / 160) Soybeans % (50 / 160) Total 160 NOTE: These percentages are used in weighting the producer s revenues
47 Step 2: Calculate Benchmark Revenues for each covered commodity planted. The Overall Benchmark Revenue is weighted based on number of covered commodities planted across the ARC-IC farm. See Next Slide for Calculations
48 Corn Year Olympic Average Revenue Yield % of T MYA $3.55 $5.18 $6.22 $6.89 $4.46 Reference $3.70 $3.70 $3.70 $3.70 $3.70 Price % Covered Commodity planted Weighted 5-year Olympic Average Revenue $ $ $ $ $ $ % $ Soybean Year Olympic Average Yield % of T MYA $9.59 $11.30 $12.50 $14.40 $13.00 Reference $8.40 $8.40 $8.40 $8.40 $8.40 Price Revenue % Covered Commodity planted Weighted 5-year Olympic Average Revenue $ $ $ $ $ $ % $175.95
49 Step 3: Calculation of the Weighted Benchmark Revenue: Corn Benchmark Revenue:($ X 68.75%) = $ Soybean Benchmark Revenue:($ X 31.25%) = $ $ Step 4: Calculate the ARC-IC Guarantee: $ X 86% = $651.95
50 Step 5: Calculate the ARC-IC Actual Revenue across ALL Covered Commodities planted: CROP 2014 Production 2014 MYA Price National Loan Rate % Of Covered Commodity Planted ARC-IC Producer Revenue Corn 160/ac $3.50 $ % $ Soybeans 48/ac $10.00 $ % $ $535.00/ac
51 Step 6: ARC-IC Payment Calculation: ARC-IC Guarantee: $ ($ X 86%) ARC-IC Actual Revenue: $ $ revenue loss Note: The payment rate can be no more than 10% of the ARC-IC Benchmark Revenue ($758.08) which is $75.81 in this example. Total Base Acres 150 X 65% X $75.81 = $7391
52 Enrollment Process: Once Election has been completed then Enrollment takes place. Mid April, 2015 Through Summer of 2015 NOTE: Both 2014 and 2015 will be completed simultaneously.
53 Annual Enrollment Contract to Participate on a farm: An enrollment period will be held for: 2014 & 2015 and completed simultaneously Completed each crop year Producers can participate OR not participate year by year. NOTE: Additional information on enrollment will be provided prior to the enrollment period, spring of 2015
54 Acreage & Production Reporting: Producers are required to report acres, same as in past programs to be eligible for ARC/PLC payments Production Reporting REQUIRED for ARC-IC since producer yields are used in the revenue calculations.
55 ARC/PLC Payments: 2014 payments are issued after October 1, 2015 for PLC/ARC-CO/ARC-IC if triggered payments are issued after MYA prices are determined and after October 1 of the subsequent year.
56 Planting and Harvesting FAV s is subject to an acre for acre payment reduction when: More than 15% of base acres of the farm enrolled in ARC-CO or PLC are planted to FAV More than 35% of base acres of a farm enrolled in ARC-IC are planted to FAV ARC/PLC Payments: 2014 payments are issued after October 1, 2015 for PLC, ARC-CO, and ARC-IC, if triggered payments are issued after MYA prices are determined and after October 1 of the subsequent year
57 Prohibition of ARC/PLC Payments Farms that have 10.0 base acres or less cannot receive a payment. EXCEPTION Socially disadvantaged or limited resource farmers or ranchers are eligible for payment on these farms. Acreage that has been developed or is determined to be non-ag (commercial/oil/coal/roads/etc.) must be removed from cropland status. Acreage enrolled into a federal conservation program.
58 Farm 1600 has 9 base acres Leigh has 5% share on the contract and certifies to being SDA/LR. Jeff has 10% share on the contract and certifies to being SDA/LR. Andy has 85% share on the contract and does NOT certify to being SDA/LR. Leigh and Jeff will receive their share of the payment; no payment will be issued for Andy.
59 Current FSA-211, Power of Attorneys, are valid for the ARCPLC program if Section A and B are marked as follows: Section A, item 2, All current and ALL future programs Section B, item 1, All Actions
60 Applicable Rules for PLC, ARC-CO & ARC-IC, 2014 through 2018 Covered Commodity Actively Engaged in Farming Cash- Rent Tenant Direct Attribution Foreign Person AGI - $900,000 HELC and WC Payment Limitation All covered commodities except peanuts X X X X X X $125,000 NOTE: The $125,000 payment limitation includes any payments received through Market Loan Gains received through Marketing Assistance Loans and Loan Deficiency payments.

61 Resources Visit FSA Website: ARC/PLC Program Information will be posted on the ARCPLC page ARC/PLC producer web-tools are available on the ARCPLC page

62 Reporting on NASS Surveys is Important to Administer Farm Programs and Crop Insurance High quality statistical information is essential for the smooth operation of federal farm programs and crop insurance programs NASS provides the FSA and RMA with important statistics that they use to serve farmers Data are provided in aggregate form so that no individual operation or operator can be identified
63 Programs that Depend on NASS State and County Level Data County Loan Rates for Wheat, Feed Grains and Oilseeds FSA Dairy Programs RMA Area Risk Protection Insurance Plan Loan Repayment Rates Conservation Reserve Program (CRP) Actual Revenue History (ARH) Pilot Program Program Parameters for ARC and PLC Non-Insured Crop Disaster Assistance Program (NAP) Livestock Disaster Assistance Programs Beginning Farmer Ownership Loan Eligibility Production Loss Calculations Funding Targets and Allocations Establishment of Transitional Yields Establishment of Price Elections on Non-Program Crops