Influence of soil moisture on
|
|
|
- Rudolf Davidson
- 5 years ago
- Views:
Transcription


1 Influence of soil moisture on PM emissions from soils Roger Funk, C. Hoffmann, W. Engel, L. Völker (ZALF) D. Öttl (Air Quality Department of Styria, Austria)
2 Soils as source for Particulate Matter Releasing processes Wind erosion Emission of large portions in short times (hours) Tillage Emission of small portions over long times (days weeks)
3 Rough quantification of the problem Estimation of annual dust emissions by wind erosion and tillage in Brandenburg (~ ha arable land) Wind erosion Tillage operations (area of summer crops) (all crops) ca ha BERLIN ca ha 10 years - average ca. 50 kg/ha 750 t (TSP <50µm) 1 2 kg/ha per tillage 3000 t (PM10) Based on field measurements of wind erosion events Assuming 2 operations per year and crop
4 Factors of influence for PM emissions of soils Soil type Soil moisture Tillage tool (sand, silt, and clay particles) (soil type, weather) (active or passive, mixing or turning, tillage depth, speed)


5 Relevance for the derivation of emission factors (emission factors are area-related but only a part of the soil contributes to the emission)
6 The objectives of our study: 1. determine the influence of soil water content on the dust emission of soils in the case of mechanical stress, as caused by tillage. 2. derive a soil-related emission factor for tillage operations depending on texture, moisture and tillage depth
7 Soil texture, humus content and water contents of the investigated soils Sand Silt and clay Organic soils Site Code Sand Silt Clay SWC SWC Humus 63-2µm < 2 µm 60 C* air-dry** 63µm % % % M% M% % Klockenhagen KLOC Siggelkow SIGG Gottesgabe GOGA Muencheberg MUEB Sandhagen SAHA Penkow PENK Gross Kiesow GRKI Hildesheim HILD Bad Lauchstedt BALA Seelow SEEL Heinrichswalde HEIN Rhinluch RHIN *SWC60 C gravimetric soil water content (mass per cent) after 24 hours oven drying at 60 C ** SWC air-dry = hygroscopic soil water content (mass per cent) after drying in the laboratory (21 C, 60% relative air humidity)
8 Preparation of the soil samples Gradations of the soil water content: Dried samples: 105 C C, 60 C C, air dry Wetted samples: air dry mass % - steps (sand) mass%- steps (other soils) dried at 105 C dried at 60 C air dry air dry g H 2 O air dry + 1.0gH 2 O and so on
")
9 Wind tunnel investigations used as Cross-flow gravitational separator according to DIN (Particle size analysis by air classification)
10 Wind tunnel investigations Charging point PM measurement
11 400 Wind tunnel investigations Measured dust concentration in the wind tunnel 300 PM10 (µg/m³) base load time step (6 second-interval) time-averaged PM concentration during the 6-minute run (µg/m³).


12 Wind tunnel investigations Measured dust concentration in the wind tunnel Concentration in the cross-section of the wind tunnel (dots are measuring points) 07m 0.7m Adjustment factor for the spatial distribution in the wind tunnel
13 Wind tunnel investigations Calculation of the total dust emission in µg per g soil TDE = SAF c m V TDE - total dust emission (µg per g), V - volume of air passing through the tunnel during the 6-minute run (m³) ), m - amount of supplied soil (g), c - time-averaged PM concentration during the 6-minute run (µg/m³). SAF - adjustment factor for the spatial distribution in the wind tunnel, 0.35
14 Results Dust emission of soils using different drying intensities 5000 PM1 0 emission (µ µg/g) oven dried at 105 C oven dried at 60 C air dried at 21 C Sand Silt Clay Organic Texture type
15 Results Hygroscopic Water - Water held within mm of the surface of a soil particle (only clay) - is essentially non-mobile and - can only be removed from the soil through heating coarser particle surrounded by clay particles Clay particles form an aggregate of a coarser fraction Predominant binding force Water bridges Predominant binding force Water bridges + van der Waals forces
16
17 Results Relationship between the content of particles < 6.3 µm (clay and fine silt) and the PM10 emission of the air dried samples (all investigated soils) mission (µg g/g) PM10 e y = 18,784x + 252,58 R 2 = 0, particles < 6.3 µm
18 Results Multiple linear regressions of the form: ln PM (µgg -1 ) = a + b SWC (M%) + c silt (%) + d clay (%) + e humus (%), Significance level p = 0.05 Soil textural class a Const. b SWC c silt d clay e humus r² Sand ln PM ln PM ln PM Silt + clay ln PM ln PM ln PM Organic soils ln PM ln PM ln PM
19 Results Multiple linear regressions (sandy soils, PM10)
20 Results Multiple linear regressions (silt, clay, organic soils; PM10)
21 Emission factors of a soil in spring and in summer Soil moisture depth profiles at the two dates of ploughing tillage speed: 1 m/s, tillage width: 1.25 m, tillage depth: 0.2 m 0 5 soil moisture (mass %) PM10 emission potential 13.4 g/m² soil depth (cm) soil specific threshold value for dust emission 76.8 g/m²
22 Comparison with measured PM emissions potential derived from soil texture and moisture profile emission calculated with dispersion model GRAL, based on field measurements Emission, spring: 13.4 g/m² 0.12 g/m² Emission, summer: 76.8 g/m² 1.05 g/m²
23 Results soils can emit particulate matter over a certain range of moisture small changes in soil moisture cause distinct changes in dust emission i (fast changes of soil surface features) The emission potential of sandy soils can increase considerably when drier than air-dry threshold values of soil moisture for dust emission depend on texture, with: sandy soils 2-5 M % silty soils 5-10 M % clay soil ~ 20 M % organic soil - 40 M %


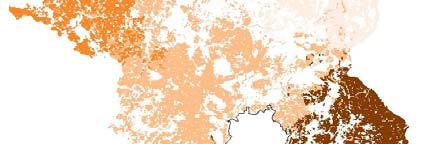
24 PM10 Emission potential of all agricultural used soils in Brandenburg BERLIN


25 Wind erosion risk and dust emission potential of the soils in Brandenburg Wind erosion risk Dust emission potential
26 Monthly wind forces and portion of bare soil in Brandenburg Wind force bare soil 25 wind force inte egral l % bare soil month 0


27 Portion of bare soil in April 2003 Statistics of grown crops for all administrative districts


28 Temporal variability of the dust emission potential Based on the percentage bare soil April - May June - July September
29
30 PM10 episods () Times with increased wind erosion risk and/or agricultural activities Autobahn Rostock Berlin Dreieck Wittstock
31 Relevance for the derivation of emission factors emission i factors for field operations should rather be related to the affected amount/volume of a soil than to the affected area with consideration of the soil moisture profile


32 Wind erosion events in Germany Wind erosion on a sandy soil OZ vom Wind erosion on a loess soil BZ


33