Maximising the use of GPS Soil sampling on a mixed farm
|
|
|
- Egbert Hubert McDaniel
- 5 years ago
- Views:
Transcription
1 Maximising the use of GPS Soil sampling on a mixed farm David Ross Senior Consultant, SAC Consulting
2 Topics for today The importance of ph The importance of P, K and S The differences in sampling systems Results from the fields tested at Limekilns What factors do you need to think about? Recommendations for lime/fert/fym?slurry What s the benefit?

3 Why are our soils important? and the sun sometimes shines!

4 Liebiggs Barrel
5 The Importance of ph
6 Why is ph so important? At soil ph values below 5.6 in mineral soils in Scotland soluble aluminium inhibits cereal root growth and reduces yield. Plant produces stubby roots instead of long fibrous roots limits nutrient uptake At best limits yield, at worst crop is a right off

7 Notice thick, stubby roots 7
8 Limits the availability of other nutrients
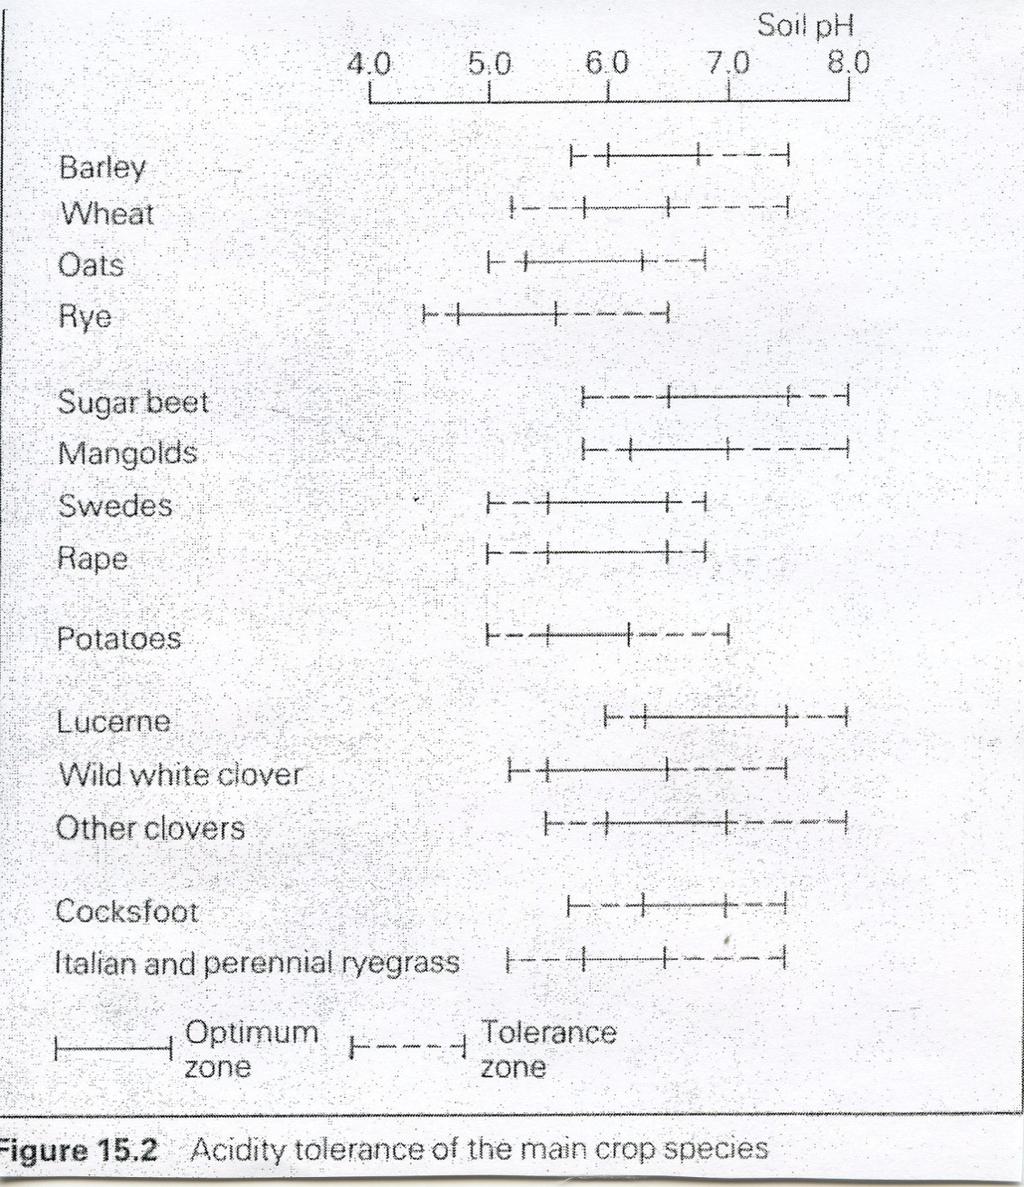
9 Importance of ph 9
10 The Importance of phosphate
11 Phosphate the facts! Helps root development and early growth Availability of P reduced in low temperatures Essential to have available P in a reseed and spring cropping
12 Phosphate supply to crops PLANT UPTAKE Crop Offtake Soil Solution P (Available For Crops) Soil Solution P (Available For Crops) P INPUT Fertiliser Manure and Slurry Desorption Sorbed P (Bound) Clay, Al, Fe Oxides Unavailable For Crops Sorption
13 Knowing our soils - Phosphate PSC 1 PSC 2 PSC 3 Arkaig Ettrick Darleith/Kirktonmoor Countesswells/ Dalbeattie/ Priestlaw Strichen Corby/ Boyndie/ Dinnet Alluvial Soils Foundland Balrownie Sourhope Tarves Thurso Yarrow/ Fleet Insch Sorn/ Humbie/ Biel Forfar Kintyre Rowanhill/ Giffnock/ Winton Kippen/ Largs Darvel Stirlng/ Duffus/ Pow/ Carbrook Millbuie Kilmarock Bargour Gleneages/ Auchenblae/ Collieston/ Darnaway Eckford/ Innerwick Mountboy Lanfine
14 Adjustment required to P application P Sorption Capacity Soil P Status Very Low (VL) Low (L) Mod (M-) Mod (M+) High (H) PSC PSC PSC The additional P required to raise the P status to moderate status
15 The Importance of Potash
16 Potash the facts! Deficiency affects Nutrient uptake Photosynthesis Rate of growth Feed value Clover sensitive to low potash Be aware of applying in the spring for risk of staggers
17 Phosphate and Potash and grass Application to reseeds is a must to help establish clover and grass Grazing Apply enough to maintain soil status Silage/Hay Replace offtake to maintain status
18 Raising a Potash Status Grass Management K 2 O Soil K Status Very Low Low Moderate High Grass with high clover, red clover K Offtake x 0.5 All other grass management Options K Offtake x 0.5
19 Importance of Sulphur
20 Sulphur Required for the efficient use of Nitrogen In the past enough received from the atmosphere New Technical Note on Sulphur about to be published Apply Sulphur with your Nitrogen

21 + 90kg/S

22 +90kg/ha S

23 No S

24 No S
25 Why use GPS soils sampling?
26 Why use GPS soil sampling? Reduce in-field nutrient variation Reduce crop variability Optimise growing conditions Maximise resource efficiency Increase average yield Increase profitability
27 Why is ph variable? Traditionally one rate for the field lime spreading techniques make it unpredictable to know where high and low ph may be Amalgamation of several fields into one may result in varied soil types Different cropping history/land management
28 Why is ph variable? Light and heavy soil types Yield differences Previous application error (overlap or over/under application) Lime tipped in fields
29 The differences in sampling systems

30 What happened in the past?
 Sample field based")

31 Electromagnetic Induction (EMI) Sample field based on scanned zones usually at 24m intervals but can be less
")
32 Electromagnetic Induction (EMI)
33 Electromagnetic Induction (EMI) Map generated similar to scanned map for ph, P and K Questions Can a spreader/operator cope with wavy results? At what point should a field be scanned (field capacity)?
34 Hectare sampling Generally offer 1 sample per ha ph, P and K 16 sub samples taken from the ha
35 Hectare sampling
36 Hectare sampling Questions Can a spreader/operator cope with wavy results?
37 Grid Based Sampling 4 samples per ha 12 sub samples (48 per ha)

38 Grid Based Sampling


39 Grid Based Sampling
40 Results from the fields tested at Limekilns
41 Field 1 - ph
42 Field 1 - Results Routine Sampling Average ph = 5.8 Arable lime requirement = 4t/ha Field Size = 12.76ha Total lime required = 51.04t
43 Field 1 Results GPS Sampling Average ph = 5.7 Range in ph = Range in lime required = 8.7t/ha 1.1t/ha Total lime required = 73.20t Difference +22t of lime

44 Field 2 ph
45 Field 2 - Results Routine Sampling Average ph = 5.9 Arable lime requirement = 3t/ha Field Size = 13.52ha Total lime required = 40.56t
46 Field 2 - Results GPS Sampling Average ph = 5.9 Range in ph = Range in lime required = 7.6t/ha 0t/ha Total lime required = 50.10t Difference +9.54t of lime
47 Field 3 ph
48 Field 3 - Results Routine Sampling Average ph = 5.5 Arable lime requirement = 7t/ha Field Size = 6.11ha Total lime required = 42.77t
49 Field 3 - Results GPS Sampling Average ph = 5.7 Range in ph = Range in lime required = 9.7t/ha 0t/ha Total lime required = 36t Difference in lime -6.77t of lime
50 Field 4 ph
51 Field 4 - Results Routine Sampling Average ph = 5.7 Arable lime requirement = 5t/ha Field Size = 6.10ha Total lime required = 30.5t
52 Field 4 - Results GPS Sampling Average ph = 5.7 Range in ph = Range in lime required = 8.7t/ha 3.3t/ha Total lime required = 34.1t Difference in lime +3.6t
53 What happens over time? 20 ph Comparison 2012 v Hectares
54 Remember the golden rules 2 t/acre (5t/ha) maximum applied in one application If more required split the application Lime can take 18 months to fully neutralise
55 Cost benefit Sampling costs vary typically 25-30/ha In this case no saving in lime in first year Typical cost benefit of applying lime is between 2:1 and 8:1 but very dependent on situation.
56 Sampling for P and K
57 What are you sampling for? Available phosphate Available potash What is the availability of P and K dependent on?

58 Limits the availability of other nutrients
59 Therefore.. Soil P and K levels may be adequate but they are not available to the plant due to low ph = Savings on P and K by correcting ph

60 Hectare sampling

61 Zoning Fields for P and K Principles. Aim is to forecast where soil fertility levels are likely to change. ph is very variable, lower cost and crops response is high - so grid sample. P, K, Mg tends to be less variable, higher cost of analysis and more intensive sampling only improves crop response when soil levels are low or high. With experience can forecast where soil fertility levels change using old field boundaries, yield levels, soil textures and farmer/advisor experience.
 Also inconsistent yield zones High yielding areas tend to be lower in P and K due to greater removal, lower yielding areas tend to be higher in P and K due to application being greater than")
62 Zoning Fields: Then use Yield Zones Divide old field boundaries up into different yield zones If the yield changes within each old field split into low, medium and high yield zones (or just low / high) Also inconsistent yield zones High yielding areas tend to be lower in P and K due to greater removal, lower yielding areas tend to be higher in P and K due to application being greater than removal.
63 Zoning Fields: Finally split using other factors. Different soil textures light soil will hold less nutrients. Slopes and hollows subject to erosion and deposition. Drainage problems Tree shade Farmer and agronomist knowledge is key.


64 Moss and clay Phosphate


65 Alluvial bank Phosphate Potash


66 Old midden sites? Potash Potash
67 Zoning The use of zones can significantly reduce the soil analysis bill compared with grid sampling. Many fields may only have 2 or 3 zones, so less costly soil analysis needs to be carried out.
68 Field 1 and 2 P Results
69 Field 3 and 4 Phosphate
70 Field 3 and 4 Potash


71 Field 1 and 2 Potash
72 Fields 3 and 4

73 Sampling Differences Phosphate
74 Potential savings - Phosphate Standard 6ha x 30kg/ha = 180kg Applied for 4 years = 720kg GPS 3 30kg/ha = 90kg 1 60kg/ha = 60kg Applied for 4 years = 600kg
75 Potential savings - Phosphate Difference = 120kg of P 120/46x100 = 260kg of TSP TSP at 362/t Saving = 94 Additional sampling cost 26 Net saving on P 68

76 Sampling Differences - Potash
77 Potential Savings - Potash Standard 6ha x 20kg/ha = 120kg Applied for 4 years = 480kg GPS 2 20kg/ha = 40kg 1 60kg/ha = 60kg Applied for 4 years = 400kg
78 Potential savings - Potash Difference = 80kg of K 80/60x100 = 133kg of MOP MOP at 290/t Saving = 39 Additional sampling cost 26 Net saving on P 13 Total savings 81 or 13.50/ha
79 What factors do you need to think about?
80 Target ph What should your target ph be? Arable rotation? Grassland rotation? Soil Type? Starting ph values?
81
82 Lime Recommendations
83 Routine ph sample ph Result Lime Requirement Adjust for Neutralising Value Lime Recommendation

84 TN656 rates at 50% NV
85 Adjusting lime rates 5t/ha at 50% NV At 56% NV = 50/56*5t/ha = 4.5t/ha At 44% NV = 50/44*5t/ha = 5.7t/ha
86 Comparing limes 45% NV for 20/t 20/45= 0.44 per % of NV 56% NV for 30/t 30/56 = 0.54 per % of NV

87 GPS files
88 Phosphate and Potash Recommendations


89 P and K Recommendations Bagged Fertiliser FYM & Slurry Soil Analysis
90 Organic Manures What s in Them? (TN650) ManureType TotalN Total (P 2 O 5 ) Total K (K 2 O) Cattle FYM Pig FYM Layer Manure Broiler Litter Cattle Slurry (3% DM) Pig Slurry (3% DM) Green Compost
91 Replace what is being taken off by the crop (TN633) Crop P Removal (kg/t) K Removal (kg/t) Winter Barley Winter Wheat Spring Barley Spring Oats Winter Oats Potatoes
92 Grass P and K Removal (TN652) Utilisation Defoliation Yield (t/ha) P Offtake (kg/ha) Silage 1 st Cut Silage 2 nd Cut Silage 3 rd Cut Hay Grazing K Offtake (kg/ha)
93 Building a Recommendation Arable Phosphate (kg/ha) Potash (kg/ha) Soil Analysis Status Low Moderate Required adjustment Spring barley removal 5t/ha FYM 25t/ha Balance
94 Building a Recommendation Grass Phosphate (kg/ha) Potash (kg/ha) Soil Analysis Status Low Moderate Required adjustment st Cut Removal 23t/ha nd Cut Removal 12t/ha Slurry spring 30m 3 /ha Slurry after 1 st cut 30m 3 /ha Balance -17 0

95 Thanks for listening