Reductions in sugarcane yields with moisture shortages (Smith, 1998) Section 16.3 SUGARCANE YIELD ESTIMATION R.E. Schuze, P.J. Hull and M.
|
|
|
- Percival Ellis
- 5 years ago
- Views:
Transcription
1 Section 16.3 SUGARCANE YIELD ESTIMATION R.E. Schuze, P.J. Hull and M. Maharaj Background Information South Africa is ranked 13th in the world (SA Yearbook, 05) as a producer of sugarcane, Saccharum officinarum. The sugar industry in South Africa employs people directly and a further indirectly (e.g. in the fertilizer, fuel, chemical, transport, food and services sectors), while a further are dependent on the sugar industry (SASA, 05). The industry contributes approximately R2.0 billion annually to foreign exchange earnings of the country (SASA, 05). Of the field crops produced in South Africa, sugarcane makes up approximately 15% of the gross value, which equates to approx 4.5% of the total agricultural production (SA Yearbook, 05). Average sucrose content of the South African crop is approx 13.5%, varying from % and inversely related to the year s rainfall. It takes approximately 8.5 tonne sugarcane to produce 1 t sugar, varying from t (SASA, 05). South Africa s sugar industry is regulated in terms of the Sugar Act and the Sugar Industry Agreement, which are binding to all sugarcane producers as well as to producers of sugar products (Trends in Agriculture, 05). Site Requirements for Sugarcane Sugarcane requires a summer growing season which is warm to hot, with daily mean temperatures optimally between 22 C and 32 C (Smith, 1998). An abundance of sunshine (> 10 hours p.a.) is needed. Conditions should be moist, with a minimum MAP 850 mm. Optimally, 1 0 mm should fall per year, with ideally 1 mm per month. Sugarcane yields are reduced by moisture shortages in accordance with the information given by Smith (1998) in the Table : Table Reductions in sugarcane yields with moisture shortages (Smith, 1998) Moisture Shortage (%) Hot summers should be followed by a dry, but sunny and frost-free (only very light frosts tolerated) winter ripening and harvesting period during which RH should be < 70% (Smith, 1998). For ripening, - C is necessary to reduce vegetative growth and increase sucrose content. Little growth takes place at temperatures < C and > 34 C and for sugarcane soil temperatures are as important as air temperatures. Production areas in KwaZulu-Natal are limited by the July minimum temperature isotherm of 5 C (Smith, 1998). The crop does well under a range of soils, but prefers well structured and aerated loams and sandy loam > 1 m deep with a PAW > 150 mm. Sugarcane thrives less well on sandy soils because nematode populations can build up easily and PAW tends to be low, while on clayey soils root development may be hindered. The crop can withstand short spells of waterlogging, but generally the water table should be below m (Smith, 1998). Sugarcane Production in South Africa Yield Reduction at Establishment/ Yield Ripening Vegetative Formation Approximately ha in South Africa is under sugarcane, of which approximately ha are harvested annually (SASA, 05). This is an increase of ha under cane from 40 years ago (Figure ). Of the area under cane, approximately 72% is rainfed and 28% under irrigation (Statistics SA, 02). Section 16.3 Agricultural Crops: Sugarcane Yield Estimation 1
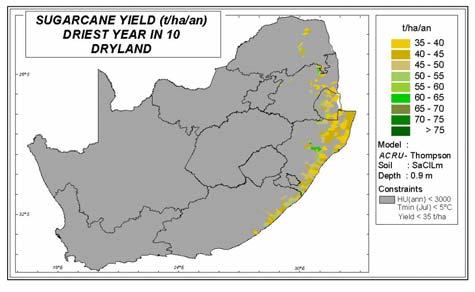
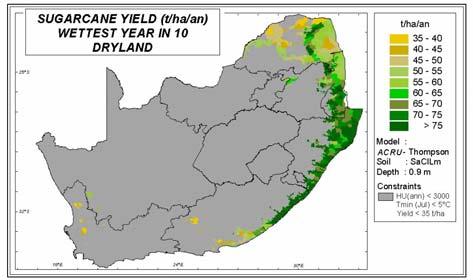
2 Area Planted ( 000 ha) and Yields (t/ha/an) Sugarcane: Area Planted, Yield and Sugar Production Year Area Planted Yield Production of Sugar Sugar Production (0 t) million tonnes per annum, largely dependent on climatic conditions. From this tonnage, around t sugar is produced per season (cf. Table ), of which half is marketed in South Africa and the remainder exported to markets in Africa, the Middle East, North America and Asia. 95% of the sugarcane crop is fertilized and this accounts for 18% of the fertilizer use in South Africa (FAO, 05). Average cane yield is 51 t/ha/annum (FAO, 05). Dryland yields do, however, vary quite considerably from year to year, as indicated in Table and these variations are by region, by cutting cycle and rainfall. Table Dryland sugarcane yields in KwaZulu-Natal by region, cutting cycle and water application (after Smith, 1998) Attribute Cutting Cycle North Coast months South Coast months KwaZulu-Natal Midlands months Figure Sugarcane in South Africa: Area planted, annualised yield and production of sugar (Source: NDA, 06) Dryland sugarcane is grown mainly in KwaZulu-Natal (97%) with smaller pockets in the Eastern Cape and Mpumalanga. Of the cane under irrigation, 72% is in KwaZulu-Natal (mainly Pongola and Mfolozi flats) and the remaining 28% in Mpumalanga (Statistics SA, 02). By gross farming income from sugarcane, 86.5% derives from KwaZulu-Natal and 12.8% from Mpumalanga. Sugarcane is grown by nearly registered producers of whom are large scale growers with an average farm size of 165 ha and producing about 78% of the total crop, while about are small-scale growers of whom half deliver cane each year and who farm on ha on average and who produce 12% of the total crop. The remaining % is produced by milling companies with their own estates (Sugar Industry, 05). Production comes from 14 mill supply areas and varies from 19 to 23 Yields at 900 mm Annual Rainfall Yield Potential per 0 mm Water (rainfall + irrigation) 81 t/ha 9.0 t/ha 67 t/ha 7.5 t/ha 58 t/ha 6.5 t/ha Distribution Patterns over South Africa of Annualised Dryland Sugarcane Yields Annualised dryland yields of sugarcane in KwaZulu-Natal are generally in the range of t/ha/annum, decreasing to below 40 t/ha over most of Mpumalanga and Limpopo. In the driest year in yields generally decrease by ~ t/ha/annum and that map shows that economically viable areas would shrink significantly in Swaziland, Mpumalanga and Limpopo. On the other hand, in the wettest year in yields would generally increase by ~ t/ha/annum over those of average years and if such climatic conditions were the norm, the economically viable area would expand considerably. Section 16.3 Agricultural Crops: Sugarcane Yield Estimation 2
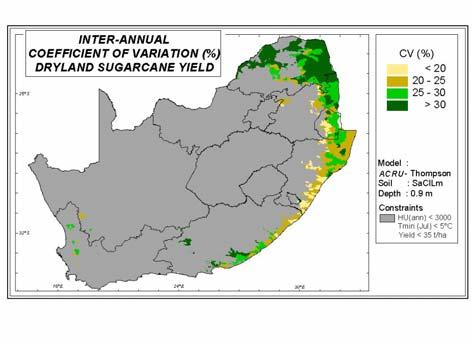
3 Distribution Patterns over South Africa of the Inter-Annual Coefficients of Variation of Annualised Dryland Sugarcane Yields Under dryland cultivation the inter-annual variability of cane yields ranges from < % to ~ 25% across KwaZulu-Natal, but would increase to > % in the more marginal dryland growing areas in Mpumalanga and Limpopo. Distribution Patterns over South Africa of Irrigated Sugarcane Yields Yields under irrigation (assumed to be demand irrigation to the soil s drained upper limit, with water applied once the soil s stress level had been reached) are essentially heat constrained, reaching t/ha/annum along the south coast of KwaZulu-Natal, t/ha/annum along the north coast and even t/ha/annum in the hotter areas of Swaziland and Mpumalanga. Because no yield constraint was applied to irrigated sugarcane, new areas along the west coast of South Africa show up, albeit with yields < 1 t/ha/annum. Estimation of Sugarcane Yield with the ACRU-Thompson Model As early as the 1970s accumulated results from overseas and South Africa led Thompson (1976) to developing an equation which related sugarcane water use (total evaporation) to yield as where Y sc = 9.53(E an / 0) and Y sc = annual sugarcane yield (t/ha), and E an = annual total evaporation (mm). It must be stressed that this equation estimates yield of cane for a 12- month (annualised) period and not for the duration of a ratoon, which in South Africa varies between months for irrigated cane in the Pongola valley and the Mpumalanga lowveld to months on the north coast of KwaZulu-Natal, months on the south coast and months in the midlands of the KwaZulu-Natal. To obtain an actual yield for a crop of sugarcane, the annualised tonnage estimated therefore has to be adjusted to account for the duration of a particular growing season. More on the Estimation of Sugarcane Yield with the ACRU- Thompson Model In this sugarcane yield model daily total evaporation, E, was calculated in the ACRU model by computing transpiration and soil water evaporation separately for both dryland and irrigated scenarios, for a July 1 to June growing year. The Thompson equation, which has stood the test of time, makes use of E calculated from day-by-day interactions of rainfall, evaporative demand, stage of growth of sugarcane and soil characteristics within the ACRU soil water budgeting system, with the model linked to the climate and soils databases of the Quaternary Catchments Database (Section 2.3) covering the RSA, Lesotho and Swaziland. Model Inputs When Estimating Sugarcane Yields In order to make comparative assessments of sugarcane yields, the following model variables were used: Soils were input as having a sandy clay loam texture and being 0.9 m thick, of which 0.3 m was the topsoil. Soil water content at - permanent wilting point was input as being 0.6 m/m (i.e. 144 mm for the 0.9 m soil), at - drained upper limit as m/m (i.e. 234 mm), and at - saturation as m/m (i.e. 405 mm). A farm area-averaged crop coefficient of 0.8 was used, and associated with that biomass was an interception loss of 1.6 mm per rainday. The coefficient of initial abstractions before stormflow commenced was input at 0.3 for all months of the year. Saturated drainage was input at 0.5 of excess water per day. Critical leaf water potential, used in the computation of onset of soil water stress, was input at -1 0 kpa. Section 16.3 Agricultural Crops: Sugarcane Yield Estimation 3

4 Model Inputs When Estimating Sugarcane Yields (continued) For irrigated sugarcane it was further assumed that irrigation was applied on demand once soil water content had reached the onset of stress, determined by the critical leaf potential, 0% of the ground was shaded by the irrigated crop with a crop coefficient of 0.8, and the majority of soil water extraction took place in the top 0.6 m of the soil. Defining Potential Sugarcane Growing Areas for this Atlas Photo 1 Using the information under Site Requirements as a guide, and in consultation with experts from the sugar industry, it was decided for purposes of mapping to define potential sugarcane growing areas not by present growing areas, but rather by the concurrence, at the Quaternary Catchment level, of the following criteria for dryland conditions: Mean annual accumulated heat units (base C) had to exceed degree days (i.e. heat requirements), July means of daily minimum temperatures had to be above 5 C (i.e. cold/frost constraints), and Means of annualised yields of cane by the ACRU-Thompson model had to exceed 35 t/ha/annum (i.e. economic limit). For irrigated sugarcane yields the economic constraint of 35 t/ha/annum was relaxed as the assumption had to be made that an adequate supply of water would be available for irrigation. The result of this was that a significant tract of land along the west coast of South Africa was identified as having the potential for producing sugarcane under irrigation a finding which will require further scientific investigation. Photo 2 Section 16.3 Agricultural Crops: Sugarcane Yield Estimation 4
 5. Statistics SA (02) 6. NDA (06) 7. Sugar Industry (05) 8. FAO (05) 9. Thompson, G.D. (1976) Photo 1 - http://virtual.yosemite.cc.ca.us/ghayes/images/139_3913% Harvesting%sugar%cane%b.")
5 Photo 3 References (In the sequence in which they appear in this Section, with the full references given in Section 22) 1. SA Yearbook (05) 2. SASA (05) 3. Trends in Agriculture (05) 4. Smith, J.M.B. (1998) 5. Statistics SA (02) 6. NDA (06) 7. Sugar Industry (05) 8. FAO (05) 9. Thompson, G.D. (1976) Photo Harvesting%sugar%cane%b.JPG Photo 2 - Schulze, R.E. Photo 3 - Schulze, R.E. Citing from this Section of the Atlas When making reference to this Section of the Atlas, please cite as follows: Schulze, R.E., Hull, P.J. and Maharaj, M. 07. Sugarcane Yield Estimation. In: Schulze, R.E. (Ed). 07. South African Atlas of Climatology and Agrohydrology. Water Research Commission, Pretoria, RSA, WRC Report 1489/1/06, Section Section 16.3 Agricultural Crops: Sugarcane Yield Estimation 5

6 Section 16.3 Agricultural Crops: Sugarcane Yield Estimation 6