2014 Annual Report for the Agricultural Demonstration of Practices and Technologies (ADOPT) Program
|
|
|
- Lester Blankenship
- 5 years ago
- Views:
Transcription

1 2014 Annual Report for the Agricultural Demonstration of Practices and Technologies (ADOPT) Program Project Title: Reclamation of Saline Soil using Perennial Forages Project Number: Producer Group Sponsoring the Project: Western Applied Research Corporation 1 of 2
2 Project Location: AAFC Scott Research Farm (NE W3, RM 380) Project start and end dates: July 2013 December 2014 Project contact person & contact details: Laryssa Grenkow, Research Manager Objectives and Rationale Project Objectives The objectives of this forage demonstration, originally established in 2011, was to determine 1. How various species of perennial forages establish under various levels of soil salinity 2. How much biomass the forages produced in each area of the salinity gradient, after three years of growth 3. If the established forages reduced the soil salinity levels in the demo area i.e. provided soil reclamation benefits over three years of growth Project Rationale Saline areas of arable annual crop land are of concern for many Saskatchewan farmers. Saline areas are spatially and temporally variable; the magnitude of area affected and severity of salinity depend on inherent landscape hydrology and differences in seasonal precipitation and soil moisture, all which affect the local water table and movement of soluble salts in the soil profile. Soils within a field with high concentrations of soluble salts can negatively impact establishment, growth and yield of many crops. In addition, persistent salt tolerant weeds, such as kochia or foxtail barley, often invade saline areas of the field, affecting the productivity of the rest of the field by acting as a weed seed source. Establishing a perennial forage in saline areas may not only supress weeds, but also provide valuable source of forage for livestock. Because perennial forages generally use more water throughout the growing season compared to an annual crop forages may provide soil reclamation benefits by lowering the local water table, reducing the risk of developing or enlarging saline areas. Farmers who have attempted to establish perennial forages in the saline areas often have mixed results in terms of successful establishment, competitiveness with weeds and forage biomass production. It is important farmers select appropriate perennial forage varieties to suit their unique soil salinity level and requirements for forage production. Methodology and Results Methodology This project was originally established in 2011 (ADOPT ). The demonstration includes ten treatments (Table 1) arranged as a randomized complete block design with three replicates. Plot size was two meters wide by approximately 25 meters long. Plots were established perpendicular to the salinity gradient ensuring all plots would transect both non-saline and saline soil. Glyphosate was applied to the trial area prior to seeding. Alfalfa treatments were seeded on October 17, 2011 and all other forage treatments were seeded on October 18, Alfalfa treatments received 62 kg P 2O 5 ha -1 as triple super phosphate, side-banded, and appropriate inoculants were applied to the seed prior to seeding. Grass species treatments receive 45 kg P 2O 5 ha -1 and 9.5 kg N ha -1 as monoammonium 2 of 2
3 phosphate, side-banded. An in-crop herbicide (Basagran Forte 0.91 L/ac) was applied to all treatments May 31, To manage excess forage biomass, all plots were swathed (August 8, 2012 and May 15, 2014) and forage biomass was removed. Table 1: Perennial forage variety, relative salinity tolerance and seeding rate Treatment Perennial Forage Salinity Tolerance Seeding Rate (kg/ha) 1 Alfalfa c.v. Rambler Low 9 2 Alfalfa c.v. Halo Moderate 9 3 Alfalfa c.v. Rugged Moderate 9 4 Tall fescue c.v. Kokanee Moderate 9 5 Tall wheatgrass High 13 6 Smooth brome c.v. Carlton Moderate 9 7 Creeping foxtail High 6 8 Saline Master z High 11 9 Green wheatgrass c.v. AC Saltlander High Hybrid wheatgrass c.v. NewHy High 11 z Saline Master is a blend of 40% green wheatgrass (c.v. AC Saltlander), 30% tall fescue, 20% smooth brome, 10% slender wheatgrass Soil salinity mapping was conducted using an EM38 on July 13, 2011 and June 3, 2014 to detect differences in salinity over time. Photographs of the forage treatments were taken in 2012 and Two 0.25m 2 forage biomass samples were taken from the non-saline, slightly saline and moderately saline areas of each plot at the end of July in 2012 and July 11 in Weeds were removed from the samples. Fresh weights of the biomass were recorded in 2012 and dry weights recorded in 2014; therefore, results will be presented as a percentage of biomass from the non-saline area within each plot to assess the changes in treatments between sampling dates. Results 2012 Forage Biomass The perennial forage species differed in their ability to colonize saline areas. Overall, the alfalfa species were poor colonizers of the saline areas. While c.v. Halo and c.v. Rugged alfalfa maintained a greater percentage of their biomass than c.v. Rambler in the slightly saline areas, all three varieties were very poor colonizers in the moderately saline areas (Table A.1). Tall wheatgrass, AC Saltlander and creeping foxtail were the best colonizers in both slightly- and moderately saline areas, maintaining biomass yield throughout the salinity gradient (Table A.1). Saline Master and NewHy were also able to maintain biomass production in the slightly saline areas, but had a large reduction in biomass production in the moderately saline areas (Table A.1). Of all grass species tested, establishment of tall fescue and smooth brome were least consistent across the salinity gradient (Table A.1). In terms of total forage biomass production, tall fescue and Saline Master had the highest biomass production in non- and slightly-saline areas, while creeping foxtail, tall wheatgrass and AC Saltlander had greatest biomass at moderately saline areas (Table A.2). Alfalfa, as expected, produced lowest amount of forage biomass relative to other species tested across the range of salinity levels (Table A.2) Forage Biomass There was a high degree of variability in forage species biomass across the salinity gradient and among replicates, likely due to increased salinity levels in the demonstration area (discussed in next section) and possibly winterkill. Forage biomass production across the salinity gradient three years after establishment was not consistent with 2012 biomass results; generally, grass species biomass production, as a percentage of biomass produced in non-saline areas, decreased from 2012 to 2014 sampling dates. 3 of 2
4 Tall wheatgrass and Saline Master appeared to be most consistent in terms of biomass production across the salinity gradient (Table A.1). Tall fescue, AC Saltlander and NewHy also maintained relatively consistent biomass production across the salinity gradient (Table A.1). Alfalfa species, again did not perform well as salinity levels increased to moderately saline levels (Table A.1). Comparing relative total forage biomass produced among forages, surprisingly, alfalfa varieties produced most biomass of all species in non-saline and slightly saline areas (Table A.3). These results are very different than 2012, where alfalfa performed poorly compared to the grass species, but we suspect it was likely a result of the mature, established alfalfa stand reached maximum productivity after the first year. Saline Master, AC Saltlander and NewHy were consistent in relative biomass production in the slightly- and moderately saline areas (Table A.3). Changes in Soil Salinity EM38 measurements produce two maps: the horizontal map shows the bulk electrical conductivity of the soil for the 0-75 cm depth increment and the vertical map shows the bulk electrical conductivity of the soil for the cm depth increment. We can thus compare surface- versus sub-soil salinity. The vertical maps indicate that the majority of the sub-soil in the demonstration area was slightly to moderately saline at both 2011 and 2014 sampling dates (Figure B.1 and C.1). Although does not appear to be much change in sub-surface salinity over time, the horizontal maps indicate the demo area surface soil became increasingly saline from 2011 and 2014 (Figure. B.2 and C.2). The majority of the area was non-saline at the beginning of the demonstration, with a gradual salinity gradient, extending to a very narrow area of severely saline soil to the east end of the demonstration area (Figure C.2). The 2014 horizontal map (Figure B.2) reveals the moderately to severely saline areas were enlarged since The water table level and precipitation (at both local and regional scales) affect water and salt movement in the soil profile. Soil salinity is the result of a higher water table in the area of discharge in the local watershed. Higher than average precipitation, resulting in higher soil moisture levels in areas of recharge can increase ground water levels. Accumulated precipitation data over the three years the demonstration was established indicates the level of precipitation was close to the longer term normal for the area (Figure D.1). However, the soil salinity at the Scott Research Farm is related to the discharge from the Phippen Aquifer. The observation well located at Unity SK shows an elevated water level over the past five years (Figure D.2), indicating that the cumulative excess precipitation in the entire watershed is likely contributing to the soil salinity at the Scott Research Farm. In addition, the demonstration area is located near the discharge area of the Scott lagoon, which may also contribute to elevated water table levels. Because soil salinity problems are related to soil water, it appears that our soil is at risk of salinity until a dry cycle can reduce inputs at recharge zones and reduce the ground water levels. Short-term perennial forages in this area may not be able to reclaim saline soils, but saline tolerant forages may allow those areas of the field to remain productive under years of more severe salinity. Perennial forages established in these area can still be used to supress weeds and be used for animal feed. As perennial forages generally use more water over the growing season than annual crops, they can be used to utilize excess groundwater and maintain lower water table levels, reducing the risk of enlarging saline areas within a field. Conclusions and Recommendations Over the short duration of this demonstration, perennial forage establishment did not reduce surface soil salinity. However, the increase in soil salinity at the Scott Research Farm is likely due to inherent watershed soil hydrological processes. Nevertheless, using saline-tolerant perennial forages can provide improve the productivity of saline areas by providing other benefits such as weed suppression and forage biomass production. In this demonstration, tall wheatgrass, creeping foxtail, AC Saltlander, Saline Master and NewHy all satisfactorily colonized slightly and moderately saline areas, whereas alfalfa species did not. Three years after establishment, alfalfa species generally produced the most biomass in non- to slightly-saline areas. AC Saltlander, Saline Master, and NewHy also provided relatively stable 4 of 2
5 biomass production in slightly- to moderately-saline areas and had relatively high biomass production in the areas as well. When selecting an appropriate perennial forage species to establish in saline areas of the field, it is important to select a species that will best suit your unique soil salinity levels and forage biomass production requirements. Additional resources may assist you in your selection: Saskatchewan Agriculture: The Nature and Management of Salt-Affected Land in Saskatchewan Alberta Agriculture: Perennial Forages for Saline Seeps Sask Forage Council Factsheet: Revegetation of Saline Soils using Salt Tolerant Grasses Sask Forage Council: Interactive Tool to Assist in the Selection of Suitable Forage Species Supporting Information Acknowledgements We would like to express our gratitude to the Ministry of Agriculture and the ADOPT program for the funding support for this project. We would like to acknowledge Sherrilyn Phelps, Eric Johnson, Anne Kirk, Tristan Coehlo, Larry Sproule, and summer staff for technical assistance with project development and implementation. The demonstration was featured at the 2012 and 2014 Scott Field Day. This report will be distributed through WARC s website and included in WARC s annual report. Appendices Appendix A. Perennial forage biomass production across a salinity gradient in 2012 and 2014 Appendix B. EM38 maps and soil analysis from demonstration area in 2014 Appendix C. EM38 maps from demonstration area in 2011 Appendix D. Climate and hydrology data Appendix E. Photographs of perennial forages in June 2014 Appendix F. Photographs of perennial forages in august 2012 Abstract Abstract/Summary Saline areas of arable annual crop land are of concern for many Saskatchewan farmers: these areas can negatively impact establishment, growth and yield of many crops. Persistent salt tolerant weeds, often invade saline areas of the field, affecting the productivity of the rest of the field. Establishing a perennial forage in saline areas may not only supress weeds, but also provide valuable source of forage for livestock. Perennial forages may provide soil reclamation benefits by lowering the local water table, reducing the risk of developing or enlarging saline areas. Farmers often have mixed results in terms of successful forage establishment, competitiveness with weeds and biomass production. The objectives of this demonstration, was to determine 1. How various species of perennial forages establish under various levels of soil salinity, 2. how much biomass the forages produced in each area of the salinity gradient, after three years of growth and 3. if the established forages reduced the soil salinity levels in the demo area. Over the short duration of this demonstration, perennial forage establishment did not reduce surface soil salinity. However, the increase in soil salinity at the Scott Research Farm is likely due to inherent watershed soil hydrological processes. Nevertheless, using saline-tolerant perennial forages can provide improve the productivity of saline areas by providing other benefits such as weed suppression and forage biomass production. In this demonstration, tall wheatgrass, creeping foxtail, AC Saltlander, Saline Master and NewHy all satisfactorily colonized slightly and moderately saline areas, whereas alfalfa species did not. Three years after establishment, alfalfa species generally produced the most biomass in non- to slightly-saline areas. AC Saltlander, Saline Master,and NewHy also provided relatively stable biomass production in slightly- to moderately-saline areas and had relatively high biomass production in 5 of 2
6 the areas as well. It is important farmers select appropriate perennial forage varieties to suit their unique soil salinity level and requirements for forage production. The demonstration was featured at the 2012 and 2014 Scott Field Day which hosted approximately 175 attendees. This report will be distributed through WARC s website and included in WARC s annual report. 6 of 2
7 Appendix A Perennial Forage Biomass Production across a Salinity Gradient in 2012 and 2014 Table A.1. Biomass production across salinity gradient as a percentage of biomass from non-saline area in 2012 and 2014 Salinity Gradient Non-Saline Slightly Saline Moderately Saline Perennial Forage Alfalfa c.v. Rambler Alfalfa c.v. Halo Alfalfa c.v. Rugged Tall Fescue c.v. Kokanee Tall wheatgrass Smooth brome c.v. Carlton Creeping Foxtail Saline Master AC Saltlander NewHy Table A.2. Ranking of perennial forage in terms of highest to lowest biomass production (wet weight) in 2012 Ranking Non-Saline Slightly Saline Moderately Saline Most Biomass Tall Fescue c.v. Kokanee Tall Fescue c.v. Kokanee Creeping Foxtail Smooth brome c.v. Carlton Creeping Foxtail Tall wheatgrass Saline Master Saline Master AC Saltlander NewHy Tall wheatgrass Saline Master Alfalfa c.v. Halo NewHy Tall Fescue c.v. Kokanee AC Saltlander Smooth brome c.v. Carlton NewHy Tall wheatgrass AC Saltlander Smooth brome c.v. Carlton Creeping Foxtail Alfalfa c.v. Halo Alfalfa c.v. Halo Alfalfa c.v. Rugged Alfalfa c.v. Rugged Alfalfa c.v. Rambler Least Biomass Alfalfa c.v. Rambler Alfalfa c.v. Rambler Alfalfa c.v. Rugged Table A.3. Ranking of perennial forage in terms of highest to lowest biomass production (dry weight) in 2014 Ranking Non-Saline Slightly Saline Moderately Saline Most Biomass Alfalfa c.v. Rugged Alfalfa c.v. Rambler Smooth brome c.v. Carlton Alfalfa c.v. Rambler Alfalfa c.v. Rugged Saline Master Alfalfa c.v. Halo AC Saltlander AC Saltlander Smooth brome c.v. Carlton Alfalfa c.v. Halo NewHy AC Saltlander NewHy Tall Fescue c.v. Kokanee NewHy Tall Fescue c.v. Kokanee Creeping Foxtail Creeping Foxtail Saline Master Alfalfa c.v. Rambler Tall Fescue c.v. Kokanee Tall wheatgrass Tall wheatgrass Saline Master Smooth brome c.v. Carlton Alfalfa c.v. Halo Least Biomass Tall wheatgrass Creeping Foxtail Alfalfa c.v. Rugged 7 of 2

8 Appendix B EM38 Maps and Soil Analysis from demonstration area in 2014 Figure B.1. Vertical EM38 maps detailing electrical conductivity at the 0-150cm depth (June 2014) Table B.1. Electrical conductivity (ds/m) ranges for regressed EM38 readings at from the 0-150cm depth Salinity Level EC (ds/m) EM38 Non-Saline Slightly Saline Moderately Saline Severely Saline Very Severely Saline >16 >194 8 of 2
9 Figure B.2. Horizontal EM38 maps detailing electrical conductivity at the 0-75cm depth (June 2014) Table B.2. Electrical conductivity (ds/m) ranges for regressed EM38 readings at from the 0-75cm depth Salinity Level EC (ds/m) EM38 Non-Saline Slightly Saline Moderately Saline Severely Saline Very Severely Saline >16 >197 9 of 2
10 Table B.3. Soil sample lab analysis results for holes 1-3 from June 2014 sampling date Hole EM 38 Depth Cl- Ca++ Mg++ K+ Na+ SO Texture 4= E.C. S.A.R. % SAT No. Reading (cm) (mg/l) (mg/l) (mg/l) (mg/l) (mg/i) (mg/i) (ms/cm) ph 1 V 46 H VL Moderate SCL Salinity SC Non Sodic SCL V 83 H 85 Severe Salinity Non Sodic V 134 H 140 Severe Salinity Slight Sodicity 0-30 VL-VCL SCL < SC SCL SCL VCL < SCL < SC of 2

11 Appendix C EM38 Maps from demonstration area in 2011 Figure C.1. Vertical EM38 maps detailing electrical conductivity at the 0-150cm depth (July 2011) 11 of 2
12 Figure C.2. Horizontal EM38 maps detailing electrical conductivity at the 0-75cm depth (July 2011) 12 of 2

13 Appendix D Climate and Hydrology Data Figure D.1. Precipitation from July 2011 to July 2014 as a percentage of normal precipitation Figure D.2. Hydrograph for WSA Observation well at Unity SK - located in the Phippen aquifer at SE W3 13 of 2


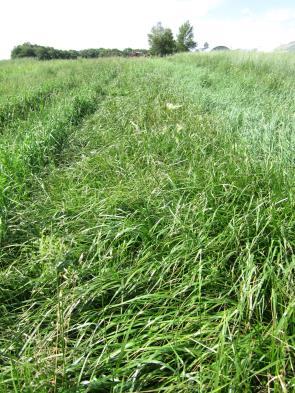
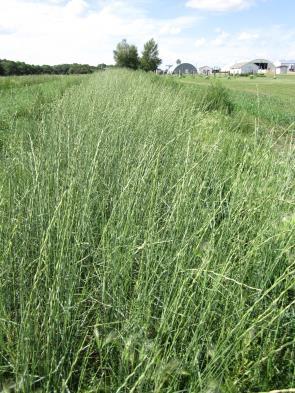
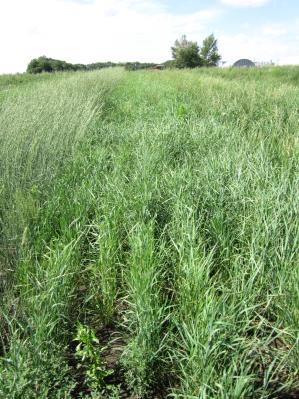
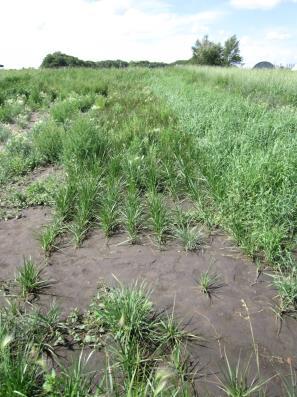
14 Appendix E Photographs of Perennial Forages in June 2014 Figure E.1. AC Saltlander Figure E.2. Saline Master Figure E.3 Tall Fescue FigureE.4. Creeping Foxtail Figure E.5. NewHy Figure E.6. Tall Wheatgrass 14 of 2


15 Figure E.7. Smooth Brome Figure E.8. Alfalfa c.v. Rambler Figure E.9. Alfalfa c.v. Halo Figure E.10. Alfalfa c.v. Rugged 15 of 2


16 Appendix F Photographs of Perennial Forages in August 2012 Figure F.1. AC Saltlander Figure F.2. Saline Master Figure F.3. Tall Fescue Figure F.4. Creeping Foxtail Figure F.5. NewHy Figure F.6. Tall Wheatgrass 16 of 2


17 Figure F.7. Smooth Brome Figure F.8. Alfalfa c.v. Rambler Figure F.9. Alfalfa c.v. Halo Figure F.10. Alfalfa c.v. Rugged 17 of 2