Integrated modeling for informing agricultural decision making in the Columbia River basin and relevance to the water management component in BioEarth
|
|
|
- Michael Sharp
- 5 years ago
- Views:
Transcription

1 Integrated modeling for informing agricultural decision making in the Columbia River basin and relevance to the water management component in BioEarth Kirti Rajagopalan, Kiran Chinnayakanahalli, Jennifer Adam, Roger Nelson, Claudio Stöckle, Michael Brady, Michael Barber, Shifa Dinesh, Keyvan Malek, Georgine Yorgey, Chad Kruger
2 Objective and Background Modeling Framework Results Relevance to BioEarth 2
3 The Washington state legislature requires a water supply and demand forecast for the Columbia River basin every five years. The objective of this work is to use an integrated biophysical and economics model to forecast the water supply and demand in the Columbia River basin in the 2030s. The primary focus is on irrigation demand. 3


4 Agriculture is a significant part of the region s economy Annual value of over $5 billion in Washington state alone Diverse crop mix Sensitive to climate change impacts on water resources availability 4

5 Temperature Annual temperature increase Summer increases are greater than other seasons Precipitation Annual precipitation: less agreement among Global Climate Models Summer precipitation decreases; other seasons increase Net effect on stream flow Shifting of water availability away from summer season of peak irrigation water demand Figure from Elsner et al.,
6 Objective Background Modeling Framework Results Relevance to BioEarth 6

7 The UW CIG Supply Forecast Slide courtesy of Alan Hamlet
8 WSU is building directly off of the UW water supply forecasting effort (Elsner et al. 2010) by starting with these tools that were developed by UW Climate Impacts Group: Implementation of the VIC hydrology model over the Pacific Northwest at 1/16 th degree resolution Reservoir Model, ColSim Historical climate data at 1/16 th degree resolution Downscaled future climate data at 1/16 th degree resolution WSU added elements for handling agriculture: integrated crop systems and hydrology irrigation withdrawals, curtailment modeling economic modeling of producer response
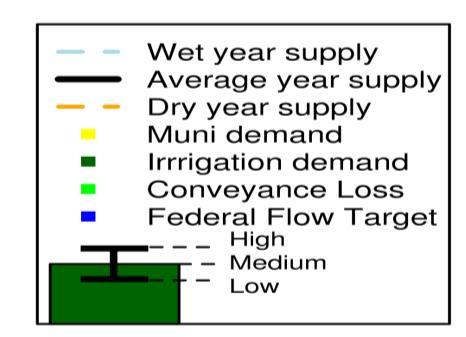
9 Biophysical Modeling System Coupled Economic hydrology Modeling and Streamflow crop Water growth Management routing model --short term producer response --physical (Selective --VIC (Elsner system deficit et al., irrigation) of 2010) dams and --CropSyst (Stocke and Nelson, 1994) reservoirs --long ColSim term (Hamlet producer et response al., 1999) and (Change a simple in reservoir crop mix due model to for domestic growth Yakima and international trade) --curtailment of interruptible water right holders Economic Modeling V. The entire biophysical modeling frame system interacts with the economic model to simulate long term and short term producer response. Selective Deficit Irrigation High value crops Medium value crops Low value crops 9
10 Full irrigation demand Biophysical Modeling System Water availability Compare demand against water availability and in stream flow targets Economic Modeling V. The entire biophysical modeling frame system interacts with the economic model to simulate long term and short term producer response. Compare excess demands against demands from interruptible grid cells Calculate deficit by crop Iterate to account for deficit irrigation 10

11 11
12 WSDA Washington State Department of Agriculture USDA US Department of Agriculture Over 40 different crop groups simulated Non-crop land cover from Elsner et al
13 Objective and Background Modeling Framework Results Relevance to BioEarth 13
14 A small increase of around 3.0 (±1.2)% in average annual supplies by 2030 compared to historical ( ) Unregulated surface water supply at Bonneville will 14.3 (±1.2)% between June and October 17.5 (±1.9)% between November and May The irrigation demand under 2030s climate was roughly 2.5% above modeled historic levels under average flow conditions 14

15 Demand: 13.3 million ac-ft Demand: 13.6 million ac-ft 2030 results are for - HADCM_B1 climate scenario - average economic growth and trade Note: Supply is reported prior to accounting for demands 15


16 Historical Future 2030s Hadcm B1 Scenario 16


17 Our rough estimates place the loss between $68-$159 million/year assuming no changes in efficiency and little adaptation of cropping practices. 17
18 Increased irrigation demand, coupled with decreased seasonal supply poses difficult water resources management questions Some watersheds more impacted than others Ability to integrate land and water resource decision making into regional-scale Earth system models 18

19 Relevance to Earth System Modeling Reservoir modeling Diversions Curtailment Ag producer responses 19


20 Reservoir simulation model for the Columbia River mainstem and its Snake River tributary The main storage and run of the river dams in the Columbia River mainstem are simulated; Snake River is approximated as sets of composite reservoirs Assumes a perfect forecast of runoff Runs at a monthly time step.

21
22 Places of use Points of diversion Interruptible surface water rights Columbia Mainstem Central Region (Methow, Okanogan, Wenatchee) Eastern Region (Walla Walla, Little Spokane, Colville) Proration in Yakima 22
23 23
24 1) Yakima - 25% (literature, USBR) 2) Columbia Basin Project Area -15% (based on modeled demand versus withdrawal data, WA DOE) 3) Methow - 40% (Water shed plan) 4) Columbia mainstem 1 mile corridor - 10% (WA DOE) 5) Outside Washington 20% 24
25 Lack of data to evaluate diversions USBR withdrawals from Bank s Lake (catering to the Columbia Basin Project area in central Washington) Modeled top of crop estimates for this region were within 15% of the withdrawal records 25
26 Standard Equilibrium Model Agent Based Model Spatially aggregated --f(growing conditions, water availability) Temporally aggregated Sequential integration This is the snowpack for this year. This is the pattern of water availability/curtailment in the last few years. What should I do? Plant crop X in Y acres this year. There is an increase in curtailment expectancy. Change the crop mix. Spatially disaggregated Temporally disaggregated Tight coupling At this time step, I have only X amount of water available, although I need Y. These are crops that have been planted. What should I do? Selective deficit irrigation or fallowing The first step for this is already implemented. 26
27 Create a more automated (perhaps simpler) reservoir model - may be an optimization approach - might need to model this offline and have a dummy storage/release in reservoir cells for the space before time version of the hydrology model in BioEarth 27
28 Create a more optimized AG producer response - choose between selective deficit irrigation and fallowing in the short run - model producer response to a wider range of factors than domestic growth and international trade in the long run 28
29 Perhaps incorporate water rights information outside of WA 29


30 30
31 Major Crops Winter Wheat Spring Wheat Alfalfa Barley Potato Corn Corn, Sweet Pasture Apple Cherry Lentil Mint Grape, Juice Grape, Wine Pea, Green Pea, Dry Sugarbeet Canola Generic Vegetables Onions Asparagus Carrots Squash Garlic Spinach Grape, Other Pastures Juice Grass hay Bluegrass Hay Rye grass Other Crops Oats Bean, green Rye Barley Bean, dry Bean, green Berries Caneberry Blueberry Cranberry Other Tree fruits Pear Peaches Hops 31
32 32
 Economic Modeling V. The entire biophysical modeling frame system interacts with the economic model to simulate long term and short term producer response.")
33 Biophysical Modeling System Economic Modeling --short term producer response (Selective deficit irrigation) --long term producer response (Change in crop mix due to domestic growth and international trade) Economic Modeling V. The entire biophysical modeling frame system interacts with the economic model to simulate long term and short term producer response. Selective Deficit Irrigation High value crops Medium value crops Low value crops 33
34 Full irrigation demand Biophysical Modeling System Water availability Compare demand against water availability and in stream flow targets Economic Modeling V. The entire biophysical modeling frame system interacts with the economic model to simulate long term and short term producer response. Compare excess demands against demands from interruptible grid cells Calculate deficit by crop Iterate to account for deficit irrigation 34