Dryland Degradation: What Should We Monitor and How? Alan Grainger School of Geography, University of Leeds
|
|
|
- Mae Theresa McCarthy
- 5 years ago
- Views:
Transcription

1 Dryland Degradation: What Should We Monitor and How? Alan Grainger School of Geography, University of Leeds
2 Who Needs Information?

3
4 Who Needs Information? All the bodies who need information on the drylands should pool their resources, so each can get information on attributes of interest to them.
5 Who Needs Information? UN Convention to Combat Desertification Global extent and rate of dryland degradation Degree of degradation of vegetation and soils Land Degradation Neutrality goal Rates of dryland degradation and dryland restoration Intergovernmental Panel on Climate Change Area and carbon stocks of woodlands Rates of deforestation and forest degradation Deforestation = forest clearance Degradation = decline in forest quality Availabilty of degraded land for restoring to sequester carbon
6 Who Needs Information? UN Framework Convention on Climate Change Rates of deforestation and forest degradation Or 40% of tropical forests excluded from REDD+ Convention on Biological Diversity Information on species and ecosystem diversity. FAO Extent and rate of change of open woodlands Global Forest Resources Assessments Forest: tree cover exceeds 10%. Other Wooded Land: tree cover 5-10% FRA 2005, 35% of Forest FRA 2010, 28% of Forest Trees outside forests

7
8 Multi-layer Geographical Information System
9 Lessons from Previous Monitoring Decisions Wrong Turnings?
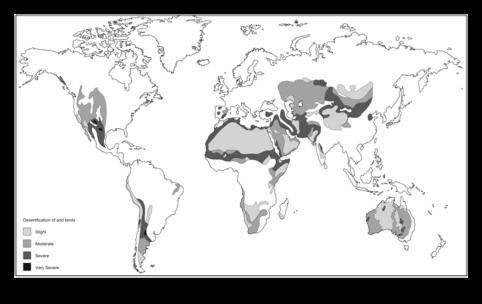
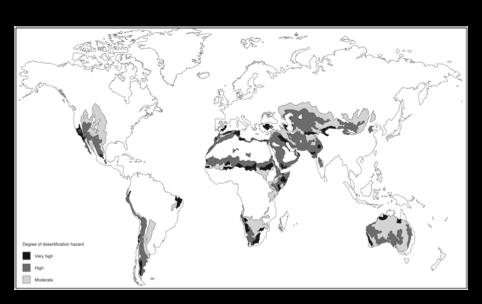
10 Plan of Action to Combat Desertification UN Conference on Desertification (UNCOD) 1977: Map of desertification status (Dregne) 2,000 million ha of drylands suffered from at least moderate desertification Map of of potential desertification hazard FAO, UNESCO and WMO National maps no link to planning UNEP World Atlases of Desertification 1992, 1997 Separate maps for different forms of soil degradation Soil degradation a proxy for desertification
11
12 UN Plan of Action Surveys
13 Areas With At Least Moderate Desertification (million ha) Dregne (1983) Mabbutt (1984) UNEP Atlas (1992) Africa Asia Australia North America South America Europe Total 2,255 2,
14
15 Plan of Action to Combat Desertification UNEP Desert Expansion Map km per year But compares wet extreme + dry extreme NASA Map (Tucker and Choudhury, 1987) Low resolution weather satellites Normalized Difference Vegetation Index Vegetation growth cyclical
16 UN Convention to Combat Desertification NDVI a proxy for all desertification? Land Degradation Assessment in Drylands Project (LADA ) FAO indicators soil, vegetation, water, climate Vegetation activity only NDVI Preliminary Map of Land Degradation 2008 NDVI only (Bai et al, 2008) Does not show degradation authors, FAO Little degradation in Africa

17 UN Plan of Action Surveys

18
19 UN Convention to Combat Desertification Since 1996 tried to identify a set of indicators to monitor desertification - no success 2009 Crunch Year Baseline Survey Blueprint (Grainger) White Paper 1 on Monitoring (Winslow et al) 1 st Scientific Conference Global Drylands Observing System UNCCD opted for a set of 'impact indicators' Compliance with political objectives Not empirical measurement
20 UN Convention to Combat Desertification Impact indicators indicators initially Only one measured the state of desertification Ad Hoc Group of Technical Experts Questioned impact indicator approach But cut to 6 indicators State of desertification indicator deleted UNCCD now wants to modify set for LDN Not possible with this approach

21 3. Refining the Impact Indicators

22 Five Step Blueprint for Measuring Dryland Degradation and Degraded Land Restoration
23 Five Steps to Measuring 1. Classify land use and land cover in drylands into seven categories: Closed Forest Open Forests/Rangeland Rainfed Cropland Irrigated Cropland Other Categories Water Bodies Natural Desert
24 Five Steps to Measuring 2. Devise set of indicators of soil degradation and vegetation degradation, specific to each land use. Vegetation degradation Soil degradation Area Water erosion Percentage vegetation/tree cover Wind erosion Biomass density Compaction Carbon density Waterlogging Ecosystem type Salinization Species density Alkalinization
25 Five Steps to Measuring 3. Assess degree of degradation by category: a. Rainfed croplands: i. Measure water erosion of soil (and reversal) by medium + high resolution satellite images (or aerial photography), plus ground data, including contextual data on Soil Health. ii. Measure wind erosion by ground measurements, accompanied by contextual data. b. Irrigated Croplands Measure degree of salinization and alkalinization by medium resolution satellite images, ground measurements of salinity and alkalinity, and contextual knowledge on Soil Health.
26 Five Steps to Measuring c. Open Forests/Rangelands Determine degree of vegetation degradation by combining aerial photography and medium to high resolution satellite images with ground measurements, and contextual information on vegetation cover and quality


27 Mapping Global Forest Area Using Landsat Images in a Week is Now Feasible With University of Maryland GDAP Software
28 Five Steps to Measuring 4. Measure annual rainfall by monitoring stations, to correct measurements of vegetation growth for cyclical variation 5. Use medium resolution satellite imagery to measure vegetation restoration.

29 Putting the Blueprint into Practice
30 Implementation Establish a Global Drylands Observing System: quickest way to produce global maps, and governments can use these to produce national maps, and maps for local and regional projects. Use multi-sensor approach: Medium resolution images (Landsat and Sentinel-2), high resolution images and aerial photography: bulk buy but still high processing time. Google Earth: good coverage now, but no dates for monitoring degradation/restoration.

31 Linguere, Senegal, on Google Earth
32 Implementation Complement remote sensing data by field data: scientific measurements plus local people inputting via web and smartphones Use virtual observatory approach: global information base need not store information on one central computer. Virtual observatory approach by World Forest Observatory initiative, using AstroGrid VO software linking multiple databases to user desktops. Channel synthesized information to policy makers and planners in a format they can use.


33 World Forest Observatory Original Global Hub Model: Superimposing Spatial Data From Multiple Sources and Sensors for Multiple Forest Attributes

34 ASTROTROP A Virtual Pan-Tropical Forest Observatory Technology Operational Technology Operational Virtual Observatory Software Provides 3 rd Lens
35 Global Environmental Observatory Channelling Outputs to Scientists and Policy Makers
36 Conclusions
37 Conclusions Drylands are complex - many bodies should pool their resources to get information on the dryland attributes of interest to them. Learn from wrong decisions in the past that perpetuated uncertainty about the drylands. Monitor each dryland attribute in the most appropriate manner: one size does not fit all. Measuring dryland degradation and degraded land restoration, technically feasible, but major organizational challenge owing to complexity.