% irrigable land of watershed area
|
|
|
- Dwain Allison
- 5 years ago
- Views:
Transcription
1
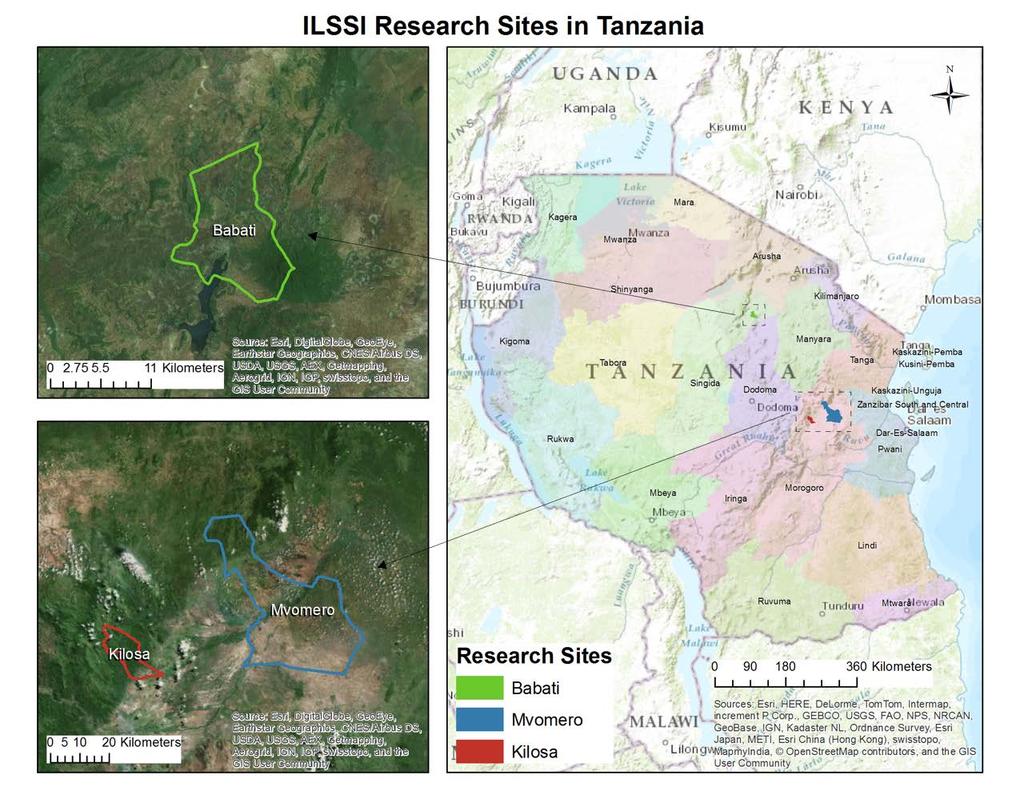
2 Tanzanian sites Watershed Rainfall (mm) Catchment area (ha) % irrigable land of watershed area Main crops Mkindo , Rice, maize Kilosa , Rice, maize Babati , Rice, maize Irrigated crops tomato Tomato, napier grass tomato Field research and expert opinion suggested that farmers in Tanzanian sites are diverting the stream flows for small-scale irrigation purposes. Irrigation was applied in areas that has a slope less than 8% and agricultural land use types. Irrigation was used for cultivating rice, tomato, and fodder during the dry season. Irrigation was not applied when there was sufficient amount of rainfall.

3 Impacts of small-scale irrigation on water balance Water balance partitioning for the Mkindo watershed before and after ex-ante scenario. Implementation of the ex-ante scenario of rice and tomato production using irrigation from rivers did not affect the overall water balance dynamics since the irrigated area was small.

4 Applied irrigation The upper part of the watershed was forest/shrub land and irrigation was not practiced. Since the source of the irrigation water was from the rivers closest to the cultivated fields, fields which are close to the rivers get more water for irrigation. The total annual volume of irrigation water in the watershed was 5,827,425 m 3, which is ~14% of the annual stream flow leaving the watershed. Average annual irrigation volumes in m 3. a) ex-ante scenario for rice and tomato production during the dry season and the main crop during the rainy season using baseline fertilizer rates, and b) ex-ante scenario for rice and tomato production during dry seasons and main crop production during the rainy season using improved fertilizer rates for maize.
5 Conclusion with the Mkindo watershed (applicable to Kilosa and Babati watersheds) There was not sufficient data to satisfactorily model watersheds in Tanzania. There is ample amount of water available for irrigation. However, there was not sufficient agricultural land for cultivation in the watersheds. Much of the area is forest, bush or grass land. The source of the irrigation water was from the closest river to the cultivated fields. Areas that are close to the rivers get more water and areas which are far away from the rivers get less water. Hence, it requires development of advanced water diversion structures to transport the water to suitable cultivate fields which are located far from the rivers.
6 Dry wt. (t/ha) Maize Maize + Fodder Apex Results The annual crops yields produced in the districts are far below global average yields; Simulated crops are rice and maize as rain-fed and tomato, cabbage and fodder as irrigated crops; Current fertilizer application rates are minimal or nil; Maize + Cabbage Maize + Tomato Multiple cropped maize with irrigated vegetables Dry wt. (t/ha) Maize Fert - Maize Fert - Maize + Fodder Fert - Maize + Cabbage Fert - Maize + Tomato Multiple cropped fertilized maize with irrigated vegetables Fertilizer application (50 kg/ha urea and 50 kg/ha DAP) increase crop yields substantially (100%); The implementation of multiple cropping systems also affected simulated crop yields, but under fertilized tomato reduced residual soil nitrogen and reduced succeeding crop yield.
7 Apex summary Simulations indicated that SRI rice production would result in higher crop water productivity compared to traditional rain-fed rice. SRI rice is the best alternative in places like Tanzania and many parts of Africa where there is suitable land for agricultural production but limited access to water. 6.0 Dry wt. (t/ha) days wet & 5 day dry SRI Rice 3 days wet & 7 days dry SRI Rice SRI rice yield simulation for 3 days wetting and 5 and 7 days drying (1981 to 2010) Simulation also indicated the sensitivity of SRI rice yields to drying and wetting periods, 7 days drying used 20% less water than 5 days drying, but yield reduced by 53% compared to 5 day drying.
8 Tanzania case studies Sites analyzed: Mkindo village in Mvomero district, Morogoro region Rudewa village in Kilosa district, Morogoro region Matufa village in Babati district, Manyara region Scenarios analyzed: Main grain crops: maize and rice Baseline: current fertilizer+ no irrigation + rain-fed rice Alternative: irrigation of tomatoes, cabbage and fodder (vetch & oats) + application of fertilizers + SRI rice (irrigated) Alt.1: rain-fed rice + recommended fertilizer + vegetables & fodder irrigation Alt.2: SRI rice + recommended fertilizer + vegetables & fodder irrigation Alt.3: SRI rice + recommended fertilizer + vegetables irrigation (no fodder) Main results (Mkindo-Mvomero): ending cash reserves and net cash income There is between 59% and 87% probability of having an ending cash reserve (EC) in year 5 that exceeds 5,000,000 TSh for a representative farmer who adopts irrigation, fertilizers and SRI system technologies (Alt.2 and Alt.3) while for non-adopters (baseline), there is zero percent probability of having an EC> 5,000,000 TSh and 77% of having EC < 700,000 TSh in year 5
 in year 3 will exceed 1,800,000 TSh for a")
 while that probability stands at 0% for a farmer who does not adopt the technology package")
9 Ending cash reserves and net cash income Main results (cont d): there is between 38% and 56% probability that the annual net cash farm income (NCFI) in year 3 will exceed 1,800,000 TSh for a farmer who adopts irrigation, fertilizers and SRI system technologies (Alt.2 and Alt.3) while that probability stands at 0% for a farmer who does not adopt the technology package (baseline scenario).
10 Ghanaian watersheds Watershed Average annual rainfall (mm) Catchment area (ha) % irrigable land of watershed area Main crops Bihinaayili , Sorghum, maize, soybean Irrigated crops Tomato, napier grass Dimbasinia , Sorghum, maize Pepper, napier grass Zanlerigu Maize, millet Tomato, napier grass The baseline survey suggested that farmers in the Bihinaayili watershed use dugouts to store water for small scale irrigation purposes. While in Dimbasinia and Zanlerigu watersheds use shallow groundwater wells for small scale irrigation purposes. Irrigation was applied in areas that has a slope less than 8% and agricultural land use types. Irrigation was used for cultivating tomato, pepper, and fodder during the dry season. Irrigation was not applied when there was sufficient amount of rainfall.

11 Ghana site Zanlerigu Nimbasinia Slope= 3.5% Slope= 2.8% Bihinaayili Slope= 3.1% SWAT site APEX site
 has generated surface runoff amount of 150-220 mm. with a catchment area of 4897.35 ha, the average annual volumetric groundwater recharge and surface runoff potentials were over 16.")
12 Bihinaayili watershed Water resources potential Much of the area (83.8%) has a groundwater recharge amount of 325 mm to 385mm. a large part of the watershed (87.85%) has generated surface runoff amount of mm. with a catchment area of ha, the average annual volumetric groundwater recharge and surface runoff potentials were over million m 3, and 8.94 million m 3, respectively.

13 Applied irrigation A large part of the irrigated area is located in the mid-land of the watershed. The source of the irrigation water was from the dugouts, which has a dimension of 42,500 m 3. The dimension of the dugout was designed to store an average annual irrigation crop water requirement for an average subbasin area including evaporation loss from the dugouts. This dugout dimension provided sufficient amount of water to the nearby irrigable fields. The total annual volume of irrigation water in the watershed was 5,099,583 m 3, which is ~23.5% of the annual stream flow leaving the watershed. Average annual irrigation volumes in m 3 during ex-ante scenario for tomato and napier production during the dry season and the main crop during the rainy season.

14 Impacts on stream flow Implementation of the ex-ante scenario resulted in a moderate reduction to the average stream flow at the outlet of the watershed. The reduction in average monthly stream flow was 32.7%. The stream flow hydrograph showed significant difference before and after the implementation of the dugouts. With the implementation of the dugouts, the peak flows considerably decreased, and the low flows increased.
15 Conclusion for Bihinaayili watershed The dimension of the dugout was designed to store an average annual irrigation crop water requirement for an average subbasin area including evaporation loss from the dugouts. The dugouts have a capacity of 42,500 m 3, and was able to store sufficient amount of water for irrigation. This type of dugout can be built as community pond and shared by group of people who have land close by. The decrease in total amount of flow as a result of implementation of dugouts for small scale irrigation purposes may have negative impacts on the downstream social-ecological systems. However, they may also have positive impacts, such as: o o o Reduction in peak flows may reduce flooding risks in downstream societies and protect species habitat from disturbance. An increase in low flows can provide different ecological benefits such as adequate habitat space for aquatic organisms, suitable water temperatures, dissolved oxygen, and water chemistry, soil moisture for plants, and drinking water for terrestrial animals. Dugouts can trap sediment influxes into streams, and thereby can reduce nutrient transport into streams.

16 Availability of shallow ground water for irrigation The average area weighted irrigation over the Dimbiasinia watershed was mm, and the average area weighted shallow groundwater recharge was mm. This suggests that the annual shallow groundwater recharge cannot support the irrigation water requirement for producing pepper and Napier grass during the dry season.
17 Conclusion for Dimbasinia (also applicable to Zanlerigu) The average annual irrigation water requirement for cultivating pepper (tomato) and Napier grass was more than the average annual shallow groundwater recharge. Implementation of irrigation for dry season pepper (tomato) and Napier grass production caused modest reduction in the monthly stream flow. Since the shallow groundwater recharge was not sufficient to meet the irrigation water requirement, it is important to combine irrigation from shallow groundwater aquifer with other water sources for small scale irrigation purposes, for example dugouts to store surface runoff for irrigation. Moreover, to decrease the reduction in stream flow, it is better to use water efficient crops for dry season cultivation.
18 APEX results Dry wt. (t/ha) The annual crops yields produced in the district are far below global average yields; Simulated crops are maize, sorghum and soybean as rain-fed and tomato, pepper and fodder (oats + vetch) as irrigated crops; Current fertilizer application rates are minimal or nil; Temperature stress Water stress Nitrogen stress Maize Maize + Pepper Maize + Fodder Maize + Tomato Stress days (days/year) Dry wt. (t/ha) Temperature stress Water stress Nitrogen stress Sorghum Sorghum + Pepper Sorghum + Fodder Sorghum + Tomato Stress days (days/year) Multiple cropped maize with irrigated vegetables Multiple cropped fertilized maize with irrigated vegetables Fertilizer application (50 kg/ha urea and 50 kg/ha DAP) increased maize and sorghum yields 100%; The implementation of multiple cropping systems also affected simulated crop yields, multiple cropping of fodder with maize and sorghum increased crop yield approximately by 100%. The study indicated that current crop yields in Ghana three sites were only 40% of the crop yield potential. With improved fertilizer application, multiple cropping and supplemental irrigation the yield can be multiplied.
19 Result summary Multiple planting of traditional rain-crops with irrigated vegetable does not increased runoff losses significantly; Application of nitrogen fertilizer for rain-fed crops and multiple cropping improved the leaf area and biomass; as a result, the soil loss has reduced significantly; Runoff (mm/year) Maize Maize + Fodder Maize + Pepper Maize + Tomato Fert - MaizeFert - Maize + Fodder Fert - MaizeFert - Maize + Pepper + Tomato Runoff yield of continuously planted maize and multiple planted, fertilized maize with vegetables (1981 to 2010) Multiple cropping may substitute the expansion of crop land with a minimal negative environmental impacts, multiple cropping also reduces the exposure of soil from wind and water erosion.
20 Ghana case studies Sites analyzed: Bihinayilli community in Savelugu district, Northern region Nimbasinia community in Kassena district, Upper East region Zanlerigu community in Nabdam district, Upper East region Scenarios analyzed: Main grain crops: maize, sorghum, millet and soybean Baseline: current fertilizer+ no irrigation Alternative: irrigation of tomatoes, red pepper and fodder (vetch & oats) + application of fertilizers + dual cropping of vegetables/fodder and soybean or maize + water lifting tools in use (pulley, diesel and solar pump) Alt.1: pulley + recommended fertilizer + dual crop veg/fodder-soybean Alt.2: rented diesel pump + recommended fertilizer + dual crop veg/fodder-maize Alt.3: rented diesel pump + recommended fertilizer + dual crop veg/fodder-soybean Alt.4: own diesel pump + recommended fertilizer + dual crop veg/foddersoybean Alt.5: own solar pump + recommended fertilizer + dual crop veg/foddersoybean
21 Ending cash reserves and net cash income Main results (Bihinayilli-Savelugu) There is between 48% and 68% probability of having an ending cash reserve (EC) in year 5 that exceeds 130,000 GH for a representative farmer who adopts irrigation using a diesel or solar pump, applies fertilizers and rotates (dual cropping) vegetables/fodder and soybean (Alt.3, 4 and 5). As for nonadopters (baseline), there is zero percent probability of having an EC > 130,000 GH and 100% of having EC < 50,000 GH in year 5. There is between 60% and 68% probability that the annual net cash farm income (NCFI) in year 3 will exceed 24,000 GH and a zero percent chance that NCFI < 8,000 GH for a farmer who applies fertilizers, practice a dual cropping system between the veg/fodder and soybean and irrigate with either a diesel or a solar pump (Alt. 3, 4 & 5). A farmer who does not adopt the technology package mentioned above (baseline) has 83% chance of having NCFI < 8,000 GH and zero percent chance of having NCFI > 24,000 GH.
22 Ending cash reserves and net cash income StopLight Chart for Probabilities of EC reserves Less Than 50,000 and Greater Than 130,000 GH StopLight Chart for Probabilities of NCFI Less Than 8,000 and Greater Than 24,000 GH 100% 90% % 90% % 70% 60% 50% % 70% 60% 50% % 40% % 20% 10% 0% Baseline Alt.1 Alt.2 Alt.3 Alt.4 Alt % 20% 10% 0% Baseline Alt.1 Alt.2 Alt.3 Alt.4 Alt Legend Baseline : No irrigation Alt.2 : Diesel_PR-MV Alt.4 : Diesel_PO-SV Alt.1 : Pulley-SV Alt.3 : Diesel_PR-SV Alt.5 : Solar_P-SV