Drought monitoring experiences of India
|
|
|
- Dwayne Shaw
- 5 years ago
- Views:
Transcription

1 REGIONAL WORKSHOP ON UNDERSTANDING THE OPERATIONAL ASPECTS OF THE DROUGHT OBSERVATION SYSTEM IN MONGOLIA, 17 Sep 2018 Drought monitoring experiences of India Dr. C.S. Murthy Head, Agricultural Sciences and Applications National Remote Sensing Centre, Hyderabad
2 Understanding Drought Weather Agricultural drought Soil Crop Management Drought - Indian Agriculture Agriculture - mainstay of Indian economy Diverse weather and cropping patterns Net cropped area 142 M ha, 60 % depends on rains Three Crop Seasons Kharif (June to November) main crop season with 105 M ha of cropped area, mostly rainfed, corresponds to prime monsoon season (South west monsoon) Rabi (Oct/Nov to Mar/April) with cropped area of about 50 M ha, mostly irrigated Summer (March to June) Complex nonlinear interactions Slow process with multi dimensional impact No single index Different states adopt different norms
 Impact monitoring Stake holders Ministries of Agriculture and Rural Development State Departments")
3 Drought Management in India Short term Management Long term Management Monitoring & Assessment Prediction & Early warning Agro-advisories Crop damage assessment Vulnerability/risk assessment Prioritization Structural and Management measures for drought proofing (soil and water conservation) Impact monitoring Stake holders Ministries of Agriculture and Rural Development State Departments of Agriculture, Revenue, Disaster Management Science and Technology institutions

4 Drought Monitoring & Assessment Department of Agriculture, Cooperation and Farmers Welfare (DACFW), Govt. of India is the Nodal agency for drought management Guidelines to states National Drought Manual 2009 National Drought Manual 2016 ( Manual provides Indices for drought monitoring Meteorological Hydrological Agriculture Drought declaration protocols Relief management Long term measures Training to states

5 Rainfall deviation from normal Normal rainfall: long term mean Deviation = (Current rainfall Normal rainfall) /Normal rainfall Extent of negative deviation is directly related to drought Meteorological drought indicators Rainfall deviation June to September 2017 Limitation of rainfall deviation as drought indicator Source MNCFC, Ministry of Agriculture

6 Rainfall Block-wise rainfall status of Odisha state (Aug 2017) Cumulative Rainfall Aug2017 Rainydays Rainfall deviation from the Normal Rainydays deviation from the Normal Deviation from Normal August Rainfall
 www.imdpune.gov.")
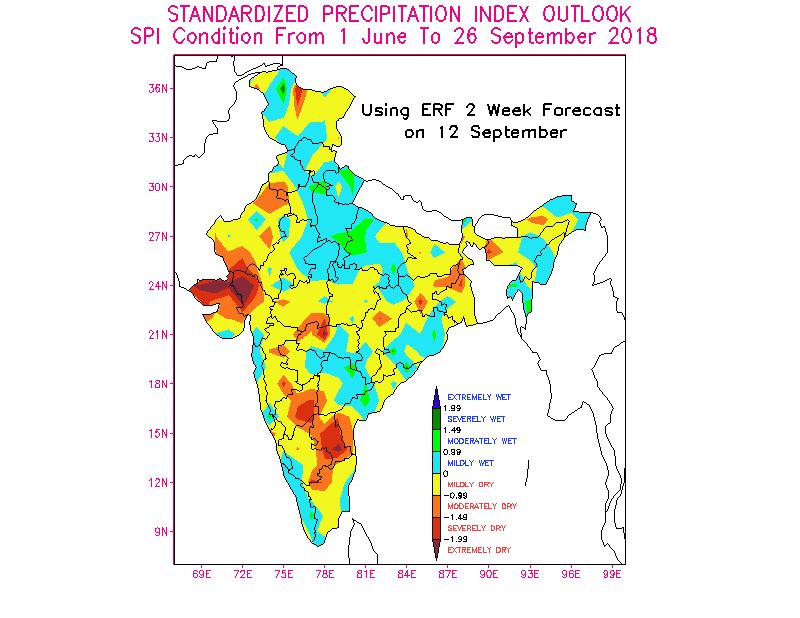
7 Based on precipitation alone Detection of dryness or wetness Versatile indicator Data transformation Gamma probability density function Needs long term data base Standardized Precipitation index (SPI)
8

9 Aridity Anomaly Aridity = AET/PET Climatic water balance Soil water balance
 Total number of station over")

10 daily ET 0 product using IMD AWS data IMD AWS provides data on near real time basis on (Temperature, Pressure, Dew Point, Wind speed, Wind direction, Sun Shine hours, Rainfall) Total number of station over India is approximately 588 Total number of station usable after quality check are approx Comparative study of FEWSNET global PET product and IMD AWS based ETo FEWSNET Global PET product over India along with the IMD AWS


, 3 min (~ 5.")
, LULC (NRC-250k), LAI, Albedo Meteorological Rainfall, Temperature, (IMD &")
11 Input dataset Elevation Web-based National Hydrological Modeling System Hydrological Modeling Framework nrsc Output Products Soil Variable Infiltration Capacity Hydrological Model Open source; Grid-wise water and energy balance Sub-grid heterogeneity of Land cover Soil depth-wise hydrological response Vegetation phenological changes Daily / sub-daily time step Runoff Land use 9 min (~16.5km), 3 min (~ 5.5km) Grid-wise data base Rainfall Geo-spatial data Terrain - Topographic, Soil (NBSSLUP), LULC (NRC-250k), LAI, Albedo Meteorological Rainfall, Temperature, (IMD & CPC) Hydrological - River discharge, Reservoir Storage/Releases, GW levels, Soil Moisture Temperature Evapotranspiration
12 Input data nrsc Meteorological Data Source Data Sources and related info. Parameter Resolution Latency Web Published VIC Model Derived Products Product Resolution Frequency IMD Gridded data IMD AWS data Rainfall, Min, Max Temperature Rainfall, Min, Max Temperature 0.5 degree 1 day Point data (interpolated to 9min/3min) 1 day Water Balance Components for entire India Forecast Surface Runoff (d*+3) 3min (~5.5km), 9min (~16.5km) 9min (~16.5km) Daily Daily IMD high density data (Godavari & Mahanadi) Rainfall Point data (interpolated to 3min) 1 day CPC Rainfall 0.1 degree 2 days Accumulated Surface Runoff Climate Indices SPI, SRI (1, 3, 6, 12 Months) 9min (~16.5km) 9min (~16.5km) Daily Daily GEFS APSDPS AWS data Rainfall, Min, Max Temperature Rainfall, Min, Max Temperature 0.5 degree (interpolated to 9min/3min) Point data (interpolated to 3min) Daily forecast data 1 day River Basin Wise Statistics - Weekly WBC s for Godavari, Mahanadi River 3min (~5.5km) Daily

 Water Balance")
13 Seasonal Water Balance Components Estimation Jun-Oct, 2016 nrsc Rainfall Evapotranspiration Runoff Daily Mean (India) Water Balance Components
 Water Balance")
14 Rainfall Seasonal Water Balance Components Estimation Jun-Oct, 2017 Evapotranspiration Runoff nrsc Daily Mean (India) Water Balance Components
15 SATELLITE MONITORING OF AGRICULTURAL DROUGHT Vegetation Indices Satellite Sensors Agricultural Drought Biophysical Parameters Meteorological Drought Rain Evapo transpiration Infiltration & Percolation Runoff Hydrological Drought Surface Storage Runoff Ground water Storage
16 National Agricultural Drought Assessment & Monitoring System NADAMS Project I N P U T S 1988 Multiple indices VI anomaly Rainfall deviation Sown area deviation Use of multiple indices IRS AWiFS based sub-district level assessment AVHRR based regional/district level assessment Integration with ground data/multiple indices Decision rules for drought warning & declaration Enhanced content & frequency of reporting Institutional participation & Capacity building IRS WiFS based district / sub district level assessment Supplementation of WiFS with MODIS AVHRR based regional/district level assessment Agricultural area monitoring IRS WiFS based district / subdistrict level assessment AVHRR based regional/district level assessment Participation of user departments NOAA AVHRR Regional/district level assessment Institutionalization transfer to MNCFC Country wide monitoring with high resolution AWiFS data Support from geo-stationery systems Utilization of microwave data Process based indictors (energy balance) Drought warning: June, July, Aug. * Normal * Watch * Alert Drought declaration: Sept, Oct., Nov. * Mild * Moderate * Severe USER DEPARTMENTS (Union & State Govts.): Agriculture Ministry Relief Commissioners O U T P U T S


 NOAA")
 SASI, NDWI Surface wetness/sown area discrimination Terra AMSRE")

17 National Agricultural Drought Assessment & Monitoring System NADAMS Meteorological drought: reduced rainfall Hydrological drought: reduced surface water Agricultural drought: reduced soil moisture NADAMS Operational service Season : kharif Objective: prevalence, intensity and persistence of agricultural drought at district/sub-district level Coverage : 13 states Satellite/ Sensor Indices Relevant Parameter Resourcesat AWiFS NDVI, NDWI Crop condition, surface wetness (60m) NOAA AVHRR (1km) NDVI Crop condition Oceansat 2- OCM (360m) NDVI, ARVI Crop condition Terra MODIS (500 m) SASI, NDWI Surface wetness/sown area discrimination Terra AMSRE )25 km) Soil moisture Surface wetness/ sown area discrimination INSAT 3A CCD (1 km) NDVI Crop condition FCC of R2 AWiFS AWiFS NDVI OCM 2 NDVI AMSR E Soil moisture SASI District level Sub-district level NDWI

18 Commonly used indices for drought assessment Most commonly adopted index NDVI a) chlorophyll based index b) plant vigour and density c) easy to compute and interpret d) robust index e) Limitations soil back ground, saturation, time lag etc. Combination of NDVI and LSWI a) Overcomes limitations of either one b) amplifies anomalies and c) more responsive to ground situation Recently popularized index LSWI a) Plant moisture based index b) NIR and SWIR based c) No saturation issues d) Immediate response e) Sensitive to surface wetness during sowing period
/normal NDVI*100 Selection of normal year average of recent past normal years NDVI is a conservative indicator and hence anomalies are not very high Thumb")
19 Interpretation of NDVI changes to assess Agricultural drought NDVI anomaly % dev. from normal (actual NDVI-normal NDVI)/normal NDVI*100 Selection of normal year average of recent past normal years NDVI is a conservative indicator and hence anomalies are not very high Thumb rule: > 20% reduction in NDVI drougt conditions >30% reduction indicate moderate to severe drought conditions
 Normal year Sep 2015")
20 Sep 2017 (partly under drought) AWiFS derived Agril. area NDVI - the main dataset for drought assessment Sep 2016 (partly cloud covered) Normal year Sep 2015 Drought year Sep 2014 Normal year Increasing vegetation vigour

21 AWiFS derived NDVI anomaly Sep 2017 vs. Sep 2014 (Showing drought affected crop lands in kharif 2017) Area under drought
22 Shortwave Angle Slope Index (SASI) SASI Sown area 000 ha Features Dry soil Wet soil SASI value highly positive low positive Features Dry vegetation Moist veg. SASI value low negative high negative Response of SASI to crop sown area Jun 25 Jun 11 Jul 27 Jul 12 Aug Weeks 28 Aug 13 Sep 29 Sep β SWIR1 = cos -1 [ (a 2 + b 2 - c 2 ) / (2*a*b) ] Slope = (SWIR2 NIR) SASI = β SWIR1 * Slope (radians) where a, b and c are Euclidian distances between vertices NIR and SWIR1, SWIR1 and SWIR2, and NIR and SWIR2, respectively SASI Chronological synchronization between (a) Decrease in SASI (b) Increase in rainfall (c) Increase in sown area Sown area NADAMS project Conceptually and computationally simple procedures to discriminate the crop sowing favorable areas at state level
23 Geospatial product on Area Favourable for Crop Sowing (AFCS) using multi-criteria approach SASI Input datasets Modelled soil moisture Soil Texture Kharif area mask Rice area mask Area Favourable for Crop Sowing/Crop Sowan Area (AFCS)
24 Soil moisture Soil moisture important data for hydrology, agriculture, environment, climate system etc. Non-spatial data I. Insitu measurements non-spatial data Manual accurate inadequate coverage Automatic systems calibration related issues large area coverage is expensive Sources of soil moisture data Hydrological models Mass balance approach Profile level moisture Parameterisation of models challenge Soil moisture products from NRSC VIC hydrological models daily soil moisture images AMSR 2 LPRM soil moisture 25 km, 2 day frequency Spatial data Satellite based Large area, daily coverage km resolution Increasing popularity Several microwave sensors SMRR TRMM TMI since 1997 Scatterometer ERS 1 & 2 ASCAT MetopA AMSRE SMOS 2009 SMAP Retrieval algorithms from passive systems NASA LPRM PRI
 Tracking the drought conditions of 2014 using LPRM Soil Moisture datasets of NRSC Soil")

25 01 jun 05 Jun 09 Jun 13 Jun 17 Jun 21 Jun 25 Jun 29 Jun 03 Jul 07 Jul 11 Jul 15 Jul 19 Jul 23 Jul 27 Jul 31 Jul 04 Aug 08 Aug 12 Aug Soil moisture (m3/m3) Tracking the drought conditions of 2014 using LPRM Soil Moisture datasets of NRSC Soil moisture deviations from normal in _11 JUNE 12_18 JUNE 19_25 JUNE 26_2 JULY 3_9 JULY 10_16 JULY 17_23 JULY 24_30 JULY 31_06 AUGUST 17_23 JULY Drought frequency in the sowing period LPRM_SM 2014 LPRM_SM 2013
26 Soil moisture Index (Derived from Hydrological Model)
27 Drought assessment and declaration by states Integrated approach with multiple criteria Mandatory indicator rainfall reduction Impact indicators Soil moisture Crop condition Surface water storage Ground water levels
28 Drought impact assessment for relief management Drought declaration Notification of affected areas Field enumeration Relief assessment and distribution


29 Mobile Apps for crop field data collection for drought impact assessment Improved field data collection system Real-time field data collection, robust & versatile system, automation etc. Surveillance of events, automated alerts generation and dissemination Objective enumeration system Field Data Collection using Geo-ICT Observation Information Transmission Decision Action Value addition and information products from field data
30 Agricultural Drought Vulnerability Index (ADVI) ADVI = EI+SI-AI Agricultural drought vulnerability assessment for long term drought management A quantitative and multi-dimensional approach for measuring crop-generic agricultural drought vulnerability status at sub-district level Vulnerability map helps visualize the hazard and act before potential damage 25 * 25 km grid level A. Exposure component 1. Total season rainfall 2. Sowing period rainfall 3. Total season rainy days 4. Sowing period rainy days B. Sensitivity component 1. Season s Integrated NDVI 2. Season s Maximum NDVI 3. Sowing period NDVI C. Adaptive capacity component 1. Soil 2. Irrigation support
 Maps & OGC Services (~7000+)")
 2009 Visualisation 2012 Mashups 2015 Platform")
31 BHUVAN Indian Geo-Platform of ISRO nrsc Visualization (22 TB) and Free Download (110 GB) Maps & OGC Services (~7000+) Applications (200+) State Portals (30) Crowd Sourcing (25 M) Mobile Apps (61+) 2009 Visualisation 2012 Mashups 2015 Platform m Data


32 1 Visulalization Platform 6.8 lakhs dwnlds Bhuvan : The Platform with Diverse Application Potential 7 Platform for Mapping 8 Platform for Disaster Support 2 Platform for Building User Applications 3 Platform for Building Mobile Applications 4 Platform for For Free Data Clearing House 5 6 Platform for States To Share data States Applications For States Satellite Data & Products Registered users : > 1.5 lakhs Download: > 1 TB per month Unique visitor : 7.0 lakhs / month Location info. : > 10 million
33 Conclusion Adopting an integrated approach with multiple indices Satellite indices are part of the system States establishing Drought Monitoring Centres Enhancing the density of weather stations Institutional participation R & D efforts are in parallel