The compound feed industry in the EU livestock economy
|
|
|
- Gillian Kelly
- 5 years ago
- Views:
Transcription

1 The compound feed industry in the EU livestock economy

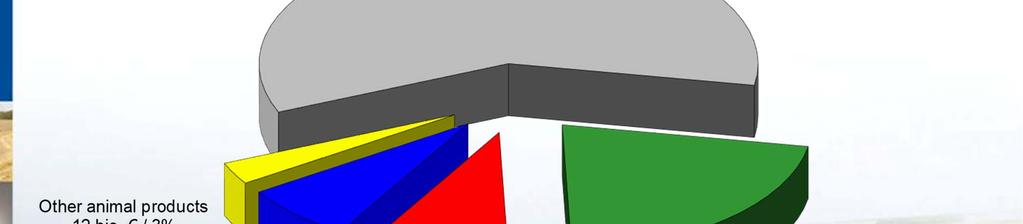
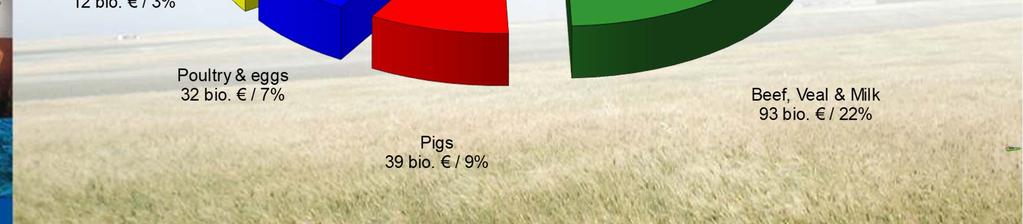
2 Value of EU-28 farm production in 2017 Source: Eurostat


3 EU-28 Livestock sourcing in feedingstuffs 489 mio. t in 2017 Source: FEFAC / EU Commission
4 Value of purchased compound feed in total animal output value in 2017 Source: FEFAC 70% 60% 50% 40% 30% 20% 10% 0% Cattle Pigs Poultry Average
5 Compound feed production in European production (Index of volume: 1995=100) 155 Source: FEFAC / Eurostat GDP at market prices Industrial production Food industry Compound feed industry
6 Comparison between prices for animal products and for feedingstuffs (Index 1995=100) Source: FEFAC / Eurostat Animal products Feedingstuffs
7 Key figures of the European compound feed industry
8 Turn-over of the compound feed industry Source: FEFAC Mio (EU-15 from 1994, EU-25 from EU-27 from EU-28 from 2013 Without Greece, Luxembourg and Malta)
9 Evolution of number and average size of feed production units Source: FEFAC EU production per unit, in t Number of units (EU-15 until 2003, EU-25 from 2004, EU-27 from 2007, EU-28 from 2013) 0
10 Industrial compound feed production per country mio. t in 2017 in the EU-28 Source: FEFAC IE 5.0 NL 14.7 PT 3.2 RO 2.9 PL 11.6 HU 3.4 IT 13.7 UK 17.0 SE 2.0 SI 0.4 BU 1.1 SK 0.7 FR 20.7 BE 6.6 CZ 2.4 Other 9.3 LV 0.3 LT 0.6 FI 1.4 EE CY AT 1.6 HR 0.6 ES 23.0 DK 4.1 DE 23.7

 Source:")
11 Industrial compound feed production in the EU-28 in mio. t (per category) Source: FEFAC
12 EU-28 compound feed production development per category +0.6% in 2018 vs 2017) EU-15 from 1995 to 2003, EU- 25 from 2004 to 2006, EU-27 from 2007 to 2012, EU-28 from 2013 Source: FEFAC total in mio. t per category in mio. t Total Cattle Pigs Poultry

13 Evolution of compound feed production in some EU-15 countries Source: FEFAC Index 100 = FR IT NL UK ES DE
14 Evolution of compound feed production in other EU-15 countries Source: FEFAC Index 100 = BE IE DK PT AT SE FI
15 Evolution of compound feed production in «new» EU-13 Member States Source: FEFAC Index 100 = CZ HU PL SK BU RO Other New Members
16 Consumption of feed materials


17 Feed material consumption by the EU-28 feed industry in 2017 Source: FEFAC
18 Feed material consumption by the EU compound feed industry Dairy products 1% Pulses 5% Minerals, Additives & Vitamins 2% Dried forage 3% All others 6.5% Feed cereals 32% Dairy products 1% Pulses 1.5% Mineral salts, Additives Dried forage & Vitamins 3% 1.5% All others 5% Feed cereals 47% Cakes & Meals 27% Cakes & Meals 25% Animal meals 3% Oils & Fats 2% Tapioca 5.5% Oils & Fats 1.5% Co-products from Food Industry 14.5% Source: FEFAC Co-products from Food Industry 12.5% Tapioca 0.5%
19 Development of feed material consumption by the EU-15 compound feed industry Source: FEFAC EU-15 AS FROM 1995 total in t Feed cereals Tapioca Co-products from Food & Bioethanol Industries Cakes & Meals


20 Usage of cereals in the EU-28 in Source: DG AGRI


21 Imports of feed materials in the EU-28 in 2017: 47 mio. t Source: EUROSTAT
22 EU-28 balance sheet for protein rich feed materials in 2016/17 EU total feed use (mio. t proteins) EU feed use of EU origin (mio. t proteins) Self-sufficiency (%) CROPS Thereof wheat barley maize oilseeds pulses CO-PRODUCTS (***) Thereof soyabean meal(*) rapeseed meal sunflower meal OTHER (****) Thereof fishmeal skimmed milk powder TOTAL (*): including soy protein concentrate (**): from EU produced seeds Source: DG Agriculture (***): excluding on farm uses for co-products other than soy, rapeseed and sunflower meal (****): excluding on farm uses

23 Sources of proteins for feed use in the EU-28 in 2016/17 Expressed in "equivalent protein", excl. forages
24 Evolution of EU protein supply self sufficiency (%) 100% Source: DG AGRI 90% 80% 70% 40% 38% 39% 36% 40% 39% 60% 50% 40% 30% 20% 60% 62% 61% 64% 60% 61% 10% 0% 2011/ / / / / /2017 EU Production Imports
25 Contribution of feed materials to protein supply and level of EU dependency in 2016/2017 % 100 Source: DG AGRI Cereals Oilseeds Pulses Soybean meals Rapeseed meal Sunflower meal Feed materials of animal origin Crops Self sufficiency Oilseed meals Protein supply (percentage of total proteins) Other co products food and biofuels industry
 163.0 Europe non-eu 86.5 Ukraine 6.6 Other non-eu 13.6 Russia 37.6 Switzerland 1.")
26 Compound feed production in EU-28 and other European countries in 2017 (in mio. t) Source: FEFAC / Alltech Turkey 22.4 Serbia 1.0 EU-28 (incl. EL) Europe non-eu 86.5 Ukraine 6.6 Other non-eu 13.6 Russia 37.6 Switzerland 1.5 Norway 3.8


27 Global compound feed production in 2017 (1,053 mio. t) Source: FEFAC / Alltech
28 Evolution of global compound feed production (Index 100 = 1999) Source: FEFAC / Alltech / Feed International EU-28 Other Europe Brazil USA China
29 Livestock production and consumption in the EU

30 Livestock population in the EU Source: Eurostat
31 Meat production development in the EU per category Source: DG AGRI, a.v.e.c total meat, in mio. t per category, in mio. t EU-15 from 1999 to 2003, EU-25 from 2004 to 2006, EU-27 from 2007 to 2012, EU-28 since 2013 Total meat Beef & Veal Pig meat Poultry meat 0
32 Meat consumption development in the EU per category Source: DG AGRI total meat, in kg/capita per category, in kg/capita EU-15 from 1999 to 2003, EU-25 from 2004 to 2006, EU-27 from 2007 to 2012, EU-28 since 2013 Total meat Beef & Veal Pig meat Poultry meat Others 0


33 Total meat consumption per capita in the EU-28 per category in 2017 Source: DG AGRI


34 EU self sufficiency in some EU agricultural products in 2017 Source: EUROSTAT/ DG AGRI