Size and Sector Effects in the Performance of Agricultural Cooperatives: The Case of Georgia
|
|
|
- Egbert Hall
- 5 years ago
- Views:
Transcription

1 Size and Sector Effects in the Performance of Agricultural Cooperatives: The Case of Georgia

2 Content 1. Introduction 2. Objectives 3. Method and Data 4. Results 5. Conclusions and Recommendations 2
3 Introduction Georgia is a small country with the total population of 3.7 million (Geostat, census 2014); Employment in agriculture was about 47% in 2015, though the share of agricultural output in total GDP was 9.2% in the same year (Geostat); According to the 2014 Census of Agriculture, there are thousand agricultural holdings in Georgia: 2,200 - legal entities (average farm size is 49.1 ha) 571,900 - households (with the average farm size of 1.2 ha). 3
4 Introduction July 2013, elaborated Law on Agricultural Cooperatives; Established the Agricultural Cooperative Development Agency (ACDA) under the Ministry of Agriculture of Georgia; For now, there are 1650 registered agricultural cooperatives in Georgia; Besides state, the agricultural cooperative development is supported by European Commission to Georgia (ENPARD project European Neighborhood Programme for Agriculture and Rural Development); In addition, some particular sub-sectors of agriculture have been supported by the government: dairy, beekeeping and hazelnut cooperatives (ACDA, 2016); In addition, gov t encourages enlargement of cooperatives. 4
5 Objectives of the Study To identify if there are important size and sector effects in the financial performance of agricultural cooperatives in Georgia. Inspired by Lerman and Parliament (1991) General Goal of the Research: Track the development of ENPARD supported cooperatives; Understand what works (and what doesn t) with regard to supporting the development of cooperatives. 5
6 Method and Data This work is based on the database collected from the ENPARD supported cooperatives. The project is implemented by four consortia of International Non-Governmental Organizations: Care, Oxfam, Mercy Corps and People in Need (PIN). The questionnaire was developed with the involvement of all consortia Each consortium collects data by itself and submit to ISET We analyzed cross-section data (2015) of 75 cooperatives which got support (financial and technical) under ENPARD project (either in 2014 or in 2015 very new established cooperatives) 6

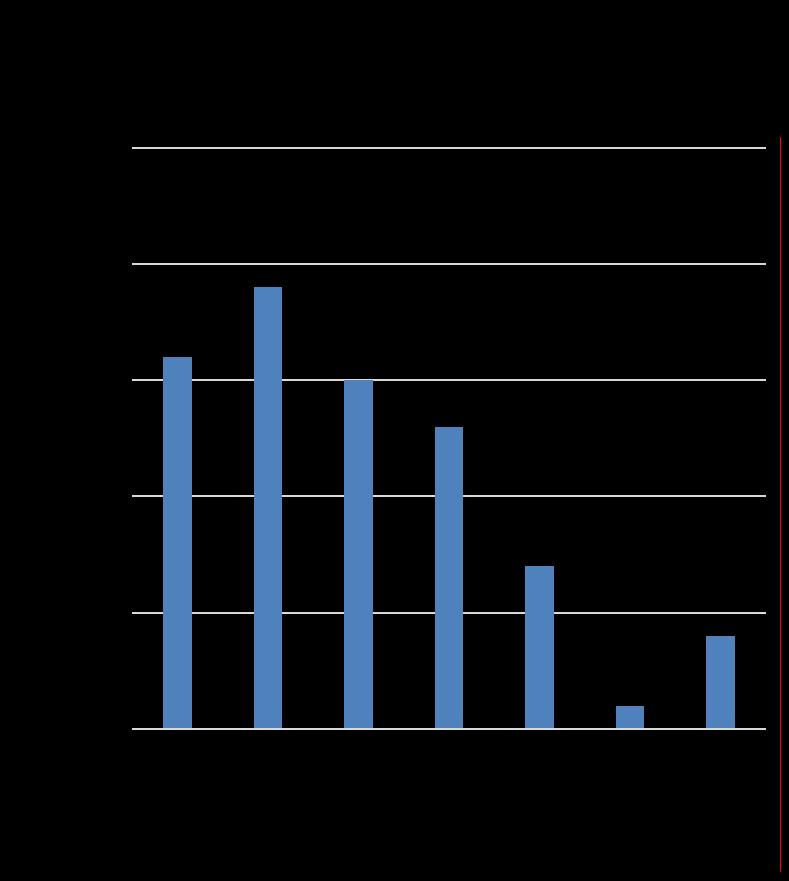
7 Method and Data Among 75 cooperatives top subsectors are: Apiculture (14) Potato (9) Viticulture (8) Average number of members per cooperative is 9.72 Biggest cooperative has 32 members and the smallest - 3 members 7
8 Method and Data In order to measure financial performance of cooperatives we calculated financial ratios measuring: efficiency profitability Efficiency Profitability 8
9 Method and Data Main Statistics of the Instruments Used for Calculating Financial Ratios Minimum Mean Median Maximum Total Amount # of Cooperativ es Net Income (25,000) 20,547 13, ,305 1,611,645 (70,595) 67 (8) Total Income 0 77,573 25,000 2,318,200 5,817, Total Assets 5,000 87,525 72, ,601 6,564, Note: calculations are made in Georgian Lari (GEL). 1 USD = 2.4 GEL (30/10/2016) 9
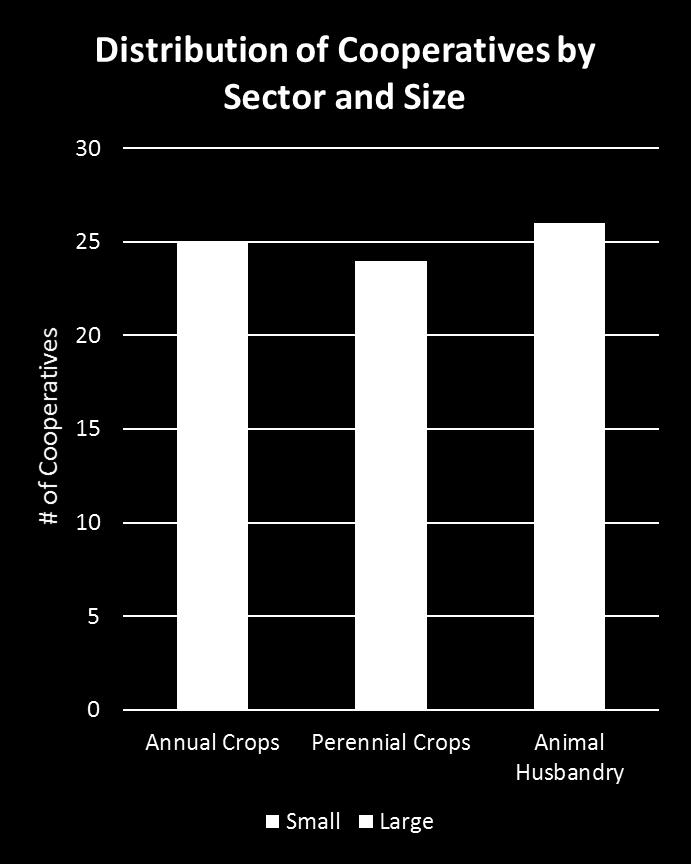
10 Method and Data We divided agricultural cooperatives in two groups, based on asset value: small large Differentiation by Size # of cooperatives Small 51 (68%) Large 24 (32%) * As a threshold we used mean value of total assets calculated with agglomerative cluster analysis Also, we formulated three groups in terms of sector: annual crops perennial crops animal husbandry Differentiation by Sectors # of cooperatives Annual Crops 25 (33%) Perennial Crops 24 (32%) Animal Husbandry 26 (35%) 10


11 Method and Data SMALL 11
12 Results Size Effects Kruskal-Wallis rank test of mean financial ratios of cooperatives by size Ratio By Size Mean Score Small (51) Large (24) Chi-square statistic Prob. > Chi-square Efficiency Turnover Ratio Profitability ROA
13 Results Sector Effects Kruskal-Wallis rank test of mean financial ratios of cooperatives by size Ratio By Sector Annual Crops Mean Score Perennial Crops Animal Husbandry Chi-square statistic Prob. > Chisquare Efficiency Turnover Ratio 47.4 *** * Profitability ROA 47.5 *** 29.0 *** 27.3 ** *** *at the 10% level of significance by the Kruskal-Wallis test **at the 5% level of significance by the Kruskal-Wallis test ***at the 1% level of significance by the Kruskal-Wallis test 37.3 * 38.8 **
14 Conclusions Size Effect by Assets: small firm effect works in terms of profitability small cooperatives are MORE profitable than large ones; This is in line with Lerman and Parliament (1991) Efficiency between small and large cooperatives was NOT found to be significantly different; Lerman and Parliament (1991) found significant difference on behalf of large cooperatives (though most surveyed cooperatives were service cooperatives in their dataset) Size Effect by Number of Members: The size effect by (mean and/or median) number of members per cooperative was NOT found to be significantly different; 14
15 Conclusions Sector Effect: The three large categories of sub-sectors are clearly differentiated by efficiency and profitability; Annual crops have the highest efficiency and profitability (in most cases statistically different), followed by animal husbandry and perennial crops; This might be explained because perennial crops take more time before giving full harvest than annual crops 15
16 Recommendations Do NOT necessarily focus on enlargement (by asset value and members) of cooperatives, while small cooperatives enjoy higher profitability; And there is NO evidence for differences in efficiency yet; In the future, Georgian cooperatives might reach the point at which they start to benefit from economies of scale (Some empirical literature provides evidence for existence of economies of scale for agricultural cooperatives); Focus MORE on service cooperative development. Although the annual crops are NOT (yet) export-oriented products, their financial performance is better than perennials (e.g., viticulture); so, orientation on domestic market has a high potential at this stage (still a big room for import-substitution, not selflimiting yet) 16
17 References Literature: Lerman, Z., & Parliament, C. (1991). Size and industry effects in the performance of agricultural cooperatives. Agricultural Economics, Volume 6, Issue 1, pp Lerman, Z., & Sedik, D., (2014). Cooperatives in the CIS and Georgia: Overview of Legislation. Policy Studies on Rural Transition No FAO Regional Office for Europe and Central Asia. Millns, J., (2013). Agriculture and Rural Cooperation, Examples from Armenia, Georgia and Moldova. Policy Studies on Rural Transition No FAO Regional Office for Europe and Central Asia. Data sources: Agricultural Cooperative Development Agency (ACDA), National Statistics Office of Georgia (Geostat), ISET & ENPARD consortia - Annual Cooperative Survey,

 Irakli Kochlamazashvili (i.")
18 Thank you! Acknowledgment Nino Kakulia Irakli Kochlamazashvili Phatima Mamardashvili 18