SOIL DEGRADATION RISK INDICATOR: ORGANIC CARBON COMPONENT
|
|
|
- Kristina Griffin
- 5 years ago
- Views:
Transcription

1 AGRI-ENVIRONMENTAL INDICATOR PROJECT Agriculture and Agri-Food Canada REPORT NO. 22 SOIL DEGRADATION RISK INDICATOR: ORGANIC CARBON COMPONENT Technical Report: Pilot Study Using the Century Model to Calculate Change in Soil Organic Carbon in Ontario Soils Prepared by: W. Smith, Consultant G. Wall, Research Branch, Agriculture and Agri-Food Canada B. Macdonald, Research Branch, Agriculture and Agri-Food Canada R. Desjardins, Research Branch, Agriculture and Agri-Food Canada SEPTEMBER 1997
2
3 PREFACE The Agri-Environmental Indicator (AEI) Project of Agriculture and Agri-Food Canada (AAFC) was initiated in 1993 in response to recommendations made by several agencies, organizations and special studies. The overall objective of the project is to develop and provide information to help integrate environmental considerations into decision-making processes of the agri-food sector. The project aims to develop a core set of regionally-sensitive national indicators that build on and enhance the information base currently available on environmental conditions and trends related to primary agriculture in Canada. The soil organic carbon component of the Soil Degradation Risk indicator is an important part of the agri-environmental indicator set. Indicators are also being developed for other aspects of soil degradation risk and in relation to issues of water quality, agroecosystem biodiversity, farm resource management, agricultural greenhouse gases and agricultural production efficiency. Research results in the form of discussion papers, scientific articles and progress reports are released as they become available. A comprehensive report is planned for fiscal-year which will include data from the 1996 Statistics Canada Census of Agriculture. Comments and questions on this paper should be addressed to: Dr. Greg Wall Ontario Land Resource Unit Greenhouse and Processing Crops Research Centres Research Branch, Agriculture and Agri-Food Canada Guelph, Ontario N1H 3N6 Telephone: (519) Facsimile: (519)
4
5 TABLE OF CONTENTS Abstract Introduction Methodology Modelling Procedure Model Input Soil Properties Climate Crop Rotations, Fertilizer, and Manure Application Tillage Erosion Calculation of the Rate of SOC Change Results and Discussion 6 List of Tables and Figures 12 Acknowledgements 13 References 14 Appendix: Maps of Soil Organic Carbon Change (SOC) in the Mixed wood Plains Ecozone, mapped at the SLC polygon and ecodistrict level 16
6 Abstract In order to develop a soil organic carbon. (SOC) indicator for Eastern Canada the Century model was run for all Soil Landscape of Canada (SLC) polygons in the Mixedwood Plains Ecozone of Ontario. Within each polygon, SOC dynamics were estimated for three or four crop rotations and two tillage practices. It was determined that the Mixedwood Plains Ecozone was losing SOC at the rate of -39.6, -34.9, -32.1, and 24.3 kg C ha -1 y -1 for the years 1981, 1986, 1990, and 1991, respectively. Such rates of loss are not measurable on a year to year basis and are usually considered to be at near equilibrium. The introduction of no-till agriculture is the principal factor that reduced the rate of loss of SOC. There was greater loss of SOC near the Southern tip of Ontario where agriculture is most intensive (less hay and pasture). The greatest loss of SOC was found in corn and soybean rotations and there was a gain in SOC under hay and pasture rotations. It was found that soil texture influences SOC dynamics with more SOC being lost in coarser textured soils. The Century model did a reasonable job in estimating SOC dynamics in Ontario. The model was developed and parameterized in the western US grasslands so it was expected to be more sensitive to western Canada SOC dynamics. Considering that the model has been tested successfully worldwide under various climatic, soil, and management practices there is likely no better tool for developing a soil carbon indicator at the present time. 1
7 1.0 Introduction Soil organic matter is important because it affects soil productivity, the physical well-being of soil, and the atmospheric content of CO 2 and other greenhouse gases. Some recent studies have indicated that the rate of change of soil organic carbon (SOC) in agricultural soils in Canada is generally near zero (Smith et al, 1996; Monreal and Janzen, 1993; Nyborg et al, 1995; Liang and MacKenzie, 1992). This is mostly because changes in SOC from land that had been converted to agriculture are now small and little new land is being converted. Current changes in SOC are mostly a result of changes in management practices such as tillage, crop rotation, and amount of fertilizer used. Management practices affect SOC storage in soils by influencing the amount of plant residues returned to the soil and the rate at which the residues decompose. The work carried out by the soil degradation indicator group has been aimed at developing methods and a data base upon which trends in soil degradation processes may be tracked through time. Indicators for soil erosion, salinity, and compaction are also being developed. The information from these studies is based on the Soil Landscape Database of Canada (SLC) and the 1981 and 1991 census. Century, a site specific computer simulation model, makes use of simplified relationships of soil-plant-climate interactions to characterize the dynamics of SOC and nitrogen for grasslands, crops, forests, and savannas. It considers several agricultural management practices such as planting, fertilizer application, tillage, grazing and organic matter addition. Climate, soil and erosion data are used in the model as input. Century is described in detail in Parton et al. (1993, 1989, and 1987). It has been extensively evaluated under contrasting soil, climate and agricultural practices. It has been used in Eastern Canada (Angers et al., 1993) Western Canada (Monreal et al., 1995), the United States (Parton et al, 1987), in Northern Europe (Paustian et al, 1992; Parton et al., 1982), as well as for soils in the tropics (Parton et al, 1989). The objective of this study was to investigate the use of the Century model for developing a SOC indicator for Eastern Canada. The Century model was used to estimate the rate of SOC change in all SLC polygons in the Mixedwood Plains Ecozone of Ontario. The intensity of agriculture in the region and the large amount of readily available data make Southern Ontario an excellent location for developing and testing a soil organic carbon indicator. 2
8 2.0 Methodology 2.1 Modelling Procedure The Century model was used to estimate carbon dynamics for 262 SLC polygons in the Mixedwood Plains Ecozone of Ontario from 1960 to Ten polygons in the ecozone were not included because of missing input data. The runs were broken into two main time blocks or time periods, one from 1960 to 1985 and the second from 1986 to The length of the time blocks varied slightly to accommodate length of rotations. 2.2 Model Input The Century model requires the input of soil properties, climate, and agricultural management practices. This section will indicate the sources of input data and describe how the data were used for the model runs Soil Properties Soil properties including soil texture, ph, bulk density, and soil organic carbon were obtained from a recent assessment carried out in Ontario by Bruce Macdonald and Bruce Gleig, of the Ontario Land Resources Unit. Their survey was incomplete when this project was carried out. Missing data were obtained from the Soil Landscape of Canada database. Initial soil organic carbon (SOC) was determined to the 30 cm depth from the A and B horizons. Fig. 1 shows the distribution of SOC within polygons of the Mixedwood Plains Ecozone for Ontario. The majority of the polygons have SOC values between 4.5 and 9.0 g C m Climate Thirty-year normal monthly minimum temperature, maximum temperature and precipitation data were estimated at the centroid for each of 262 SLC polygons by "kriging" (a technique used for generating maps) the weather data from all the weather stations in and surrounding the Mixedwood Plains Ecozone in Ontario Crop Rotations, Fertilizer and Manure Application Crop rotations, as well as fertilizer and manure application rates for each ecodistrict, were determined from the 1981 and 1991 Census (Bruce MacDonald, personal communication). The same fertilizer and manure application rates as well as crop rotations were used for all SLC polygons in an ecodistrict. Crop, fertilizer, and manure application practices for 1981 were used throughout the first Century time block (1960 to 1985), likewise, practices for 1991 were used throughout the second time block (1986 to 2000). The crop rotations used in this study are shown in Table 1. Horticultural crops and tobacco were not included in the simulations because these crops are not included in the Century model. 3

9 Figure 1. Distribution of SOC to the 30 cm depth for all polygons in the Mixedwood Plains Ecozone. 4
10 Table 1. Crop rotations for the Mixedwood Plains Ecozone Ecozone. Rotation Code R2 R4 R6 R7 R8 R9 R10 R11 R12 Rotation Corn, Beans, Winter wheat Corn and Beans Corn (x2), Spring cereal (x2), Hay (x3-5) Spring cereal (x2), Hay (x3-5) Continuous corn Continuous beans Continuous hay Improved pasture Unimproved pasture Due to time constraints, carbon dynamics could not be simulated for all rotations. The three or four most important rotations in each SLC polygon were simulated, accounting for more than 75% of the area in 27 of the 30 ecodistricts. The scheduling of events including planting, harvest, and tillage were done in accordance with Smith et al, Tillage Century simulations were carried out for conventional and no-tillage systems. No-tillage management was added only in the second time block (1986 to 2000) and simulations were carried out for an SLC polygon only when the no-tillage area was greater than 5% (1991 Census) Erosion The annual amount of soil erosion in 1981 and 1991 was based on an indicator study of soil erosion risk (Greg Wall, personal communication). 5
11 2.3 Calculation of the Rate of SOC Change The rate of SOC change for the years 1981, 1986, 1990, and 1991 was determined by taking the slope of a 10 year regression centred on each particular year. For instance, the regression for the year 1991 was done over the time period from 1986 until Such a procedure was required to account for rotations which were several years long. For rotations of durations longer than 5 years the regression was carried out for twice the length of the rotation. T C C = ' F 1 t (' F 1 c C c ) Calculation of the rate of SOC change for each SLC polygon was done by weighting the results by tillage type and crop rotation as follows: where C= rate of SOC change for a polygon, T = number of tillage practices, C = number of crop rotations, F t = fraction of area covered by tillage practice, F c = fraction of area covered by crop rotation, and C c = rate of SOC change for the crop rotation. 3.0 Results and Discussion Almost 1400 runs of the Century model were carried out for various climatic, soil, and management conditions in order to investigate the potential of using this model as a tool for developing a carbon indicator. As indicated in Table 2, the Century model predicted that there is a small amount of SOC loss in the Mixedwood Plains Ecozone of Ontario but that the amount of loss is declining over time. The values reported in this table are small. Such rates of change cannot be measured to a significant degree in field trials at the present time. Recent studies have indicated that net CO 2 emissions from agricultural soils in Canada are generally near zero (Smith et al, 1996; Monreal and Janzen, 1993; Nyborg et al, 1995). This is mostly because changes in SOC from land conversion is now small. Current changes in SOC are mostly a result of changes in management practices such as tillage, crop rotation, and amount of fertilizer used. In Ontario the introduction of no-till agriculture, particularly in 1991, resulted in a more rapid decrease in SOC loss. 6
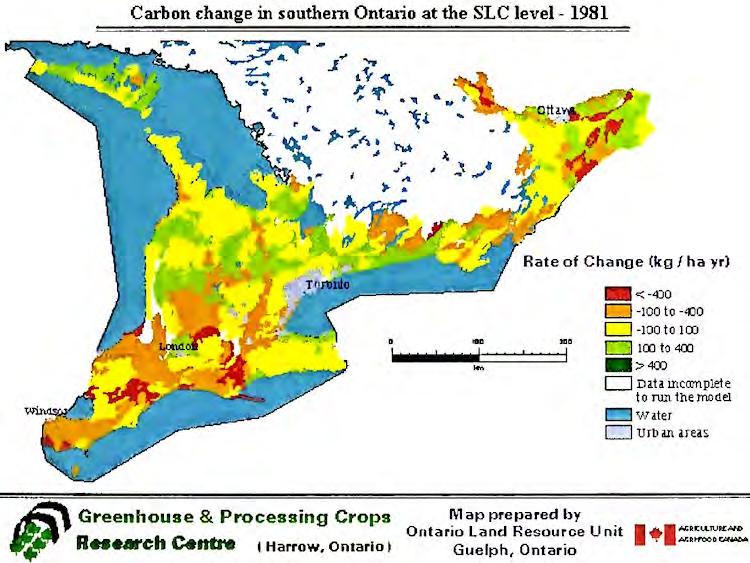
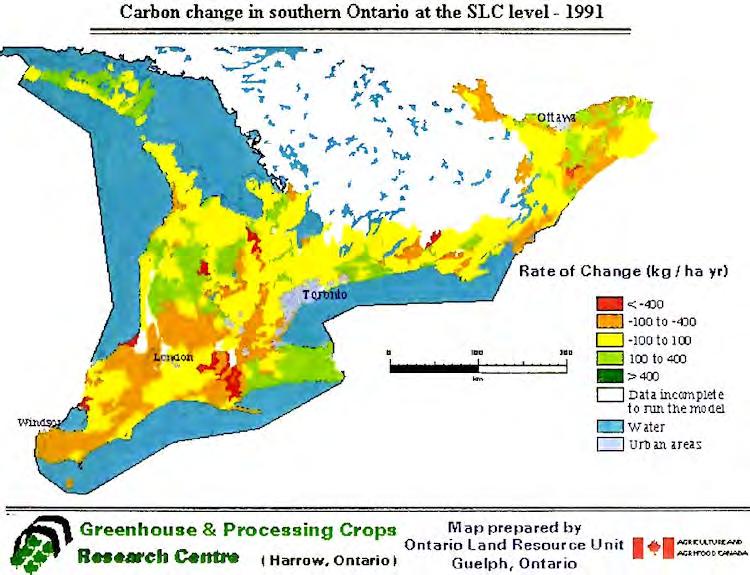
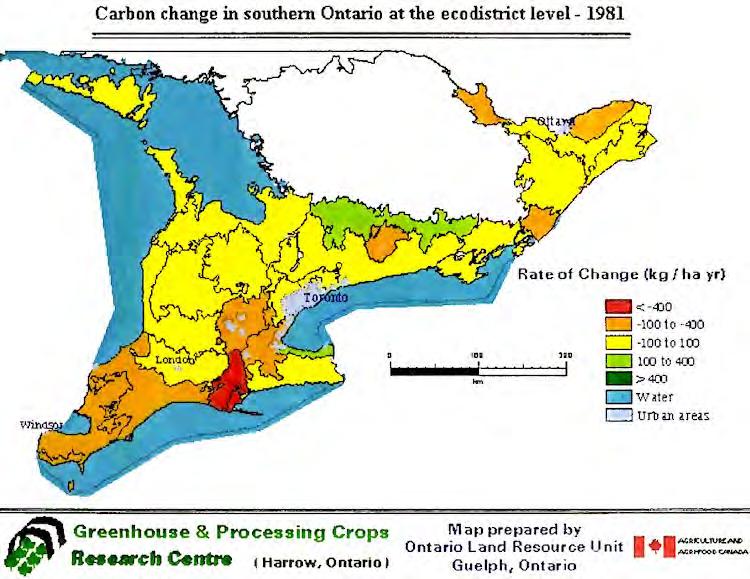
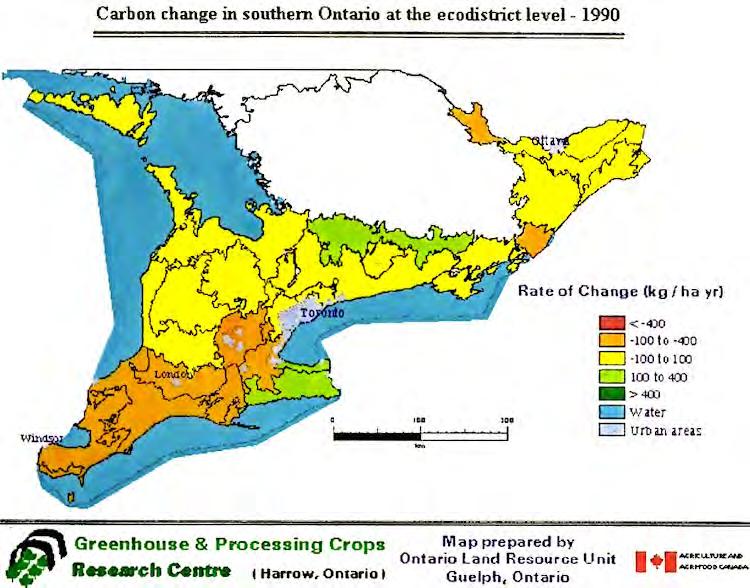
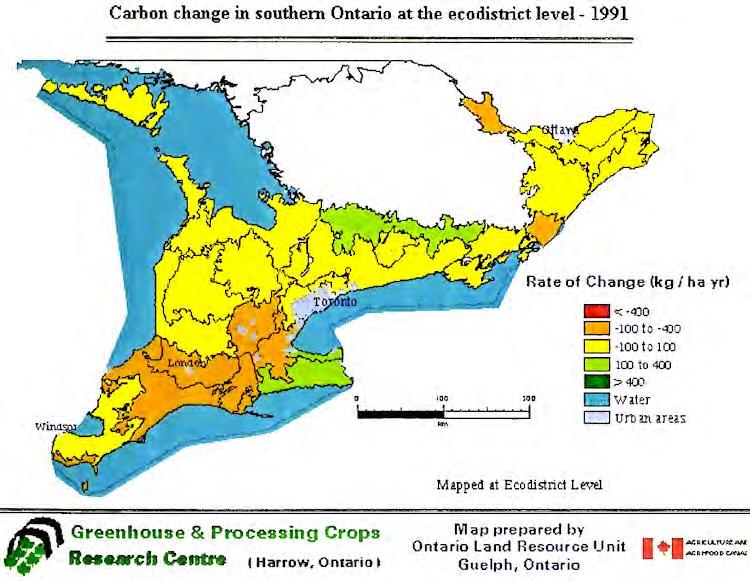
12 Table 2. Yearly rate of SOC change in the Mixedwood Plains Ecozone of Ontario. Year Rate (kg C ha -1 ) SOC (Mt) The rate of SOC loss of kg C ha -1 in 1991 compares reasonably well with the value of -14 kg C ha -1 as determined by Smith et al, The rate of SOC change in this study was calculated from 262 polygons whereas it was determined with only 26 polygons in the study by Smith et al, Soil properties, climate, and management practices in this study were determined from more complete sources than in Smith et al, The rate of SOC change within each ecodistrict for 1981, 1986, 1990, and 1991 is shown in Table 3. There is quite a large variation between ecodistricts. A wide range of SOC rates occurs throughout the Mixedwood Plains Ecodistrict. There are few spatial trends. There is, however, a greater amount of loss in the Southern tip of Ontario where agriculture is very intensive. Ecodistricts 557, 565, 567, 568, 570, 571, and 572 all show a loss of SOC from 1980 to Maps of SOC change at both the polygon and ecodistrict scales for the years 1981, 1986, 1990, and 1991 are shown in Appendix A. In 1981, Century predicted that the southern tip of Ontario and the area southeast of London had the greatest SOC loss. Considerable loss of carbon also occurred in some polygons near Ottawa but other polygons in the area gained carbon such that the larger scale ecodistrict map for 1981 shows little loss of SOC near Ottawa. As the maps progress from 1981 through to 1991 less SOC is lost or more SOC is gained throughout the Mixedwood plains ecozone. The polygon map for 1991 still indicates that greater than 400 kg ha -1 y -1 of SOC was being lost in some polygons, particularly southeast of London where the soils still have a high SOC content. A frequency distribution of the rate of SOC change for all 262 sampled polygons is shown in Fig.2. In 1991 there were more polygons closer to equilibrium than in previous years. There were less polygons losing or gaining large amounts of SOC. 7
13 8
14 Table 3. Yearly rate of SOC change (kg C ha -1 ) for each ecodistrict of the Mixedwood Plains Ecozone in Ontario. Ecodistrict Polygons Area (kha)

15 Figure 2. Frequency distribution of SOC change for 262 polygons in the Mixedwood Plains Ecozone in Ontario. 10
16 The rate of SOC change for each crop rotation is shown in Table 4. Rotations with corn and beans lost the greatest amount of SOC. As expected, rotations with hay and pasture stored the most SOC. As previously mentioned, more SOC was lost in ecodistricts near the Southern tip of Ontario where agriculture is more intensive. Table 4. Rate of SOC Change (kg C ha -1 ) for Each Crop Rotation. Number of Rotation polygons in Rotation code which rotation occurs R2 Corn, Beans, Winter wheat R4 Corn and Beans R6 Corn (x2), Spring cereal (x2), Hay (x3-5) R7 Spring cereal (x2), Hay (x3-5) R8 Continuous corn R9 Continuous beans R10 Continuous hay R11 Improved pasture R12 Unimproved pasture Soil texture strongly influences SOC dynamics in agricultural soils. The output from Century indicated that finer textured soils usually gained more SOC. In 1991, the rate of SOC change in fine, medium, and coarse textured soils was 24.7, 0.6, and kg C ha -1, respectively. Fine textured soils were classed as any soil finer in texture than a silty loam and coarse textured soils were those coarser in texture than a loam. 11
17 LIST OF TABLES Table 1: Crop rotations for the Mixedwood Plains Ecozone 5 Table 2: Yearly rate of SOC change in the Mixedwood Plains Ecozone of Ontario 7 Ecodistricts of Southern Ontario Table 3: Yearly rate of SOC change (kg C ha -1 ) for each ecodistrict of the Mixedwood Plains Ecozone in Ontario 9 Table 4: Rate of SOC change (kg C ha -1 ) for each crop rotation 11 LIST OF FIGURES Figure 1: Distribution of SOC to the 30 cm depth for all polygons in the Mixedwood Plains Ecozone 4 Figure 2: Frequency distribution of SOC change for 262 polygons in the Mixedwood Plains Ecozone in Ontario 10 12
18 Acknowledgements The authors would like to thank Sebastien Millette and Brian Grant for technical assistance and Bruce Gleig for providing agricultural management information for Southern Ontario. 13
19 References Angers, D.A., Voroney, P. Bolinder, M. and Martel, J Carbon sequestration by agricultural ecosystems in eastern Canada, a model approach. Green Plan, Greenhouse Gases Initiative report, Sainte-Foy, QC. 90 pp. Liang, B.C. and A.F. MacKenzie Changes in soil organic carbon and nitrogen after six years of corn production. Soil Sci. 153: Macdonald, B. January, Personal Communication. Monreal, C. and H.H. Janzen Soil organic carbon dynamics after eighty years of cropping a Dark Brown Chernozem. Can. J. Soil Sci. 73: Monreal, C.M., Zentner, R.P. and Robertson, J.A Sustainability of soil organic matter level and its effect on wheat yield (In press). Nyborg, M., E.D. Solberg, S.S. Malhi, and R.C. Izaurralde Fertilizer N, crop residue, and tillage alter soil C and N content in a decade. p In: R. Lal et al., (eds.) Soil Management and Greenhouse Effect Lewis Publishers, Boca Raton. Parton, W.J., Sherlock, J.M.O., Ojima, D.S., Gilmanor, T.G., Scholes, R.J., Schimel, D.S., Kirchner, T., Minaut, J.C., Seastedt, T., Garcia Moya, E., Kamnalrut, A. and Kinyamario, J.I Observations and modelling of humus and soil organic matter dynamics for the grassland biome worldwide. Global Biogeochemical Cycle. 7: Parton, W.J., Sanford, R.L., Sanchez, P.A. and Stewart, J.W.B Modelling soil organic matter dynamics in tropical soils. In: Dynamics of soil organic matter in tropical ecosystems. D.C. Coleman, J.M. Oades, and G. Vehara (eds.). Parton, W.J., Schimel, D.S., Cole, C.U. and Ojima, D.S Analysis of factors controlling soil organic matter levels in great plains grasslands. Soil Sci. Soc. Am. J. 51: Parton, W.J., Persson, J. and Anderson, D.W Simulation of organic matter changes in Swedish soils. Paper presented at the third international congress on the state-of-the-art in ecological modelling, Colorado State University. Paustian, K., Parton, W.J. and Person, J Modelling soil organic matter inorganic-amended and nitrogen-fertilized long-term plots. Soil Sci. Soc. Am. J. 56:
20 Smith, W.N., P. Rochette, C. Monreal, R.L. Desjardins, E. Pattey, and A. Jaques The rate of SOC change in agricultural soils in Canada at the landscape level. Can. J. Soil Sci. 77: Smith, W.N., R.L. Desjardins, E. Pattey, and A. Jaques Estimated Rates of Carbon Change in Agricultural Soils in Canada from 1970 to Manuscript in preparation. Wall, G. January, Personal Communication. 15
21 Appendix Maps of soil organic carbon change in the Mixedwood Plains Ecozone, mapped at the polygon and ecodistrict levels Carbon change in southern Ontario at the SLC level Carbon change in southern Ontario at the SLC level Carbon change in southern Ontario at the SLC level Carbon change in southern Ontario at the SLC level Carbon change in southern Ontario at the ecodistrict level Carbon change in southern Ontario at the ecodistrict level Carbon change in southern Ontario at the ecodistrict level Carbon change in southern Ontario at the ecodistrict level
22 17
23 18
24 19
25 20
26 21
27 22
28 23
29 24