Subject: Submission of manuscript for publication in Punjab Geographer.
|
|
|
- Shana Pearson
- 5 years ago
- Views:
Transcription
1 Dr. H.S. Mangat, Editor Punjab Geographer 3037, Urban Estate, Phase-II, Patiala Date: Subject: Submission of manuscript for publication in Punjab Geographer. Respected Sir, I / We are here with submitting a softcopy of our research paper entitled to be considered for publication in the Punjab Geographer. We also certify that it is our original work and neither the whole article nor any substantial portion of it has been submitted or published elsewhere. I/we will be happy to incorporate valuable comments/suggestions of the referees meant to improve the quality of this paper. Thanking you. Name(s), Address (es), Phone and id: Files attached: 1. Covering letter (in MS Word file) 2. Text (in MS Word file) 3. Figures (in JPG format at 300 dpi) 4. Tables (in MS Word file)
2 FORMAT FOR MANUSCRIPT TEXT PREPARATION Text of the manuscript in general should be arranged in the following order. 1. Title (Should be brief, clear and descriptive and in capital letters) 2. Abstract (Should include in brief the need of the study, methodology, aim and findings, not more than 200 words). 3. Introduction (Study should be properly defined and supported by adequate review of literature. justification of the study should also be given). 4. Study Area (Brief geographical description of the area under study). 5. Objectives of the Study (Only those objectives should be mentioned that have been achieved in the study). 6. Hypotheses/ Research Questions (If any, but must be proved and answered in the text) 7. Database and Methodology (Mention the sources of data, methodology of data collection if any, and statistical techniques utilized to analyze the data.) 8. Results and Discussion (Should be discussed under suitable headings and subheadings) 9. Major Findings (If any) 10. Conclusions 11. Suggestions (If any) 12. Acknowledgement(s) (If any) 13. References (Strictly as per the guidelines of Punjab Geographer). 14. Mention in the text where the Fig. or Table is to be inserted. 15. Name and address of the author (s) should not be mentioned. Example follows:
3 CHANGING COMPOSITION OF LIVESTOCK IN HARYANA: A SPATIO- TEMPORAL ANALYSIS Abstract The present paper evaluates the changing pattern of livestock composition and its growth pattern in Haryana. The study brings out that during last four decades the cattle rearing has been progressively marginalized in the state. Cows have been replaced by buffaloes which account for about 84 per cent of total livestock units. Ovine (sheep and goats) rearing has also been marginalized due to progression of green revolution and squeeze of grazing lands. But commercial poultry farming has picked up particularly, in north-eastern region and areas adjoining Delhi. The density of livestock units is high in the eastern and south-eastern parts of the state, the regions marked by wheat-rice cropping pattern and high intensity of cropping. The study also reveals that the state of Haryana has experienced livestock specialization as evident from increasing proportion of buffaloes during last four decades. Introduction Livestock rearing is an important component of the agricultural economy, a major supplier of livelihood for the poor and a major determining factor of human diet and health (Steinfeld et al., 2006). In recent period the demand of livestock products has increased due to growth of human population, income growth and urbanization (Thornton, 2010). It is a sub-sector of agricultural economy and also part of mixed farming system. As an economic activity, the livestock sector produces about 1.4 per cent of the world s GDP. The sector s growth rate was 2.2 per cent over the period 1995 to 2005 (FAO, 2006). The food consumption pattern in the world is changing very fast. The worldwide trend reveals that there is a rapid increase in the
4 consumption of livestock products (Devendra and Thomas, 2002). This has resulted in significant changes in the composition of livestock all over the world. The growth of cattle population has gradually declined from almost 2 per cent per year in the 1960s to less than 1 per cent per year over the last decade in the world (FAO, 2013). Livestock sector has been playing an important role in Indian agricultural economy too (Kumar and Singh, 2008). Presently, India has the largest livestock populations in the world. It accounts for 56.7 per cent buffaloes, 12.5 per cent cattle, 20.4 per cent small ruminants, 2.4 per cent camels, 1.4 per cent equines, 1.5 per cent pigs and 3.1 per cent poultry birds of the world. In , livestock generated outputs worth Rs billion (at prices) accounted for 4 per cent GDP and 26 per cent agricultural GDP of the country. It is an important source of employment and ultimate livelihood for 70 per cent population in rural areas (Planning Commission, 2012). Livestock sector plays a significant role in providing nutritive food, to the general public and supplementing family incomes and generating gainful employment in rural sector, particularly among the landless, small, marginal farmers and women (Thammi et al., 2006). Livestock rearing plays a vital role in the economy of Haryana as well. It contributes in supplementing the family income, particularly for small and marginal farmers and landless people. The livestock continues to be an integral part of agricultural sector because it provides economic stability to the farmers in face of uncertainties in the agricultural production in drylands or rain-fed farming (Rana, 2004). It also plays a diversity of roles in rural society, providing milk, draught power, meat, wool, manure and household fuel. The livestock sector continues showing beneficial impacts, particularly on the rural poor, by improving their income, providing employment and consumption of food. There is a considerable contribution of livestock to agricultural income. Its share in the value of output of agriculture and allied activities is about 30 per cent in Haryana.
5 The composition of livestock has undergone a drastic change over last four decades in the state (Elumalai and Panday, 2003). Introduction of green revolution in mid-sixties led to emphasizing crop production and ignoring livestock rearing. Due to introduction of new agricultural technology the pasturelands were converted into farmlands. During last two decades the liberalization and globalization has also influenced the livestock composition and economy. It has introduced entrepreneurship in livestock rearing. Hence, there is an urgent need of understanding the changing composition and significance of livestock in Haryana s economy. Objectives of Study The present study is aimed at the following objectives: To assess the spatio-temporal changes in composition and diversity of livestock in Haryana. To examine the growth pattern of different livestock species in the state. To evaluate the present distribution and density of livestock in the state. Area of Study Haryana is a small state in north-west India extending over an area of about km 2. Its territory extends between the latitudes 27º 39` N to 30º 55` N and longitudes 74 º27` E to 77 º36` E. The climate of the state is largely subtropical semi-arid type having rainfall varying from 300 mm in west to 1100 mm in the north-east. The state can be divided into four agro-climatic regions namely north-eastern region, southern region, eastern region and western region. Being a semi-arid area the agro-ecological conditions in the state are conducive for the growth of many nutritious grasses and thereby rearing of the livestock. Sources of Data The present study is based on secondary sources of data. The district-wise data of
6 livestock species are collected from the livestock census 1966, 1972, 1977, 1982, 1988, 1992, 1997, 2003 and 2007 from Department of Animal Husbandry and Dairying, Panchkula, Haryana and Statistical Abstract, Department of Economic and Statistical Analysis, Government of Haryana. Population data have been derived from Census of India, 2001 and The data on geographical area of districts to calculate density of livestock are collected from Directorate of Economics and Statistics, Ministry of Agriculture, Government of India. District-wise variations in composition of TLUs of animal species, density of livestock and livestock-human ratio have been studied for the year Methodology The livestock species have different body weight and these cannot be taken as one unit. Hence, all the numbers of different livestock species are converted into Tropical Livestock Units (TLUs) to study their composition. The concept of TLU provides a suitable method for determining the quantity of different livestock species and sizes in a standardized manner (Jahnke, 1982). In this concept an Exchange Ratio has been developed whereby different species of different average size can be compared and described in relation to a common unit (Jahnke et al., 1988). For a number of applications there is a requirement to use a common unit to represent livestock numbers of various types as a single figure that describes the total amount of livestock present irrespective of the specific composition. It is a modified TLUs method, which is based on the law of body size and metabolism (Kleiber, 1932; Pratt and Rasmussen, 2001). TLUs method is used for quantifying a wide range of different livestock types and size in a standardized manner (Njuki et al., 2011). For the present study all livestock units have been converted into TLUs as most animals in Haryana are of tropical origin. For this purpose cow is taken as standardized animal which has 250 kg weight. Metabolic weight = Live weight (0.75)
7 Table 1 shows the method of calculation of TLUs for the state of Haryana as a whole. Same calculation has been done for all the districts of the state. Category-wise changes in livestock population have been analyzed across the periods by computing simple averages and percentages to show per cent share of various categories. (Please Insert Table 1 here) Compound growth rate of livestock units during inter census periods has been computed with the help of under mentioned formula. where, R is annual compound growth rate of area, x1 is the population during earlier period, x2 is during later period and (i) is interval between two periods. Livestock density is computed in terms of ratio given below. The spatial pattern of composition of livestock and temporal changes are depicted with the help of tables, maps and diagrams. Results and Discussion Changes in Livestock Composition The livestock population in Haryana consisting mainly of buffaloes, cows, sheep and goats increased from 55.3 million in 1966 to 88.5 million in The livestock in the state has been dominated by buffaloes. The composition pattern of the livestock has changed noticeably over the period as shown in Table 2. Over last four decades the proportion of cattle units in the
8 total TLUs of Haryana has declined from 35.3 per cent in 1966 to 11.5 per cent in The trend is quite reverse in case of buffaloes as their proportion in TLUs increased from 58.0 per cent to 83.6 per cent during the same period. It shows that Haryana farmers have a very strong preference in favour of buffalo rearing. In spite of introduction of cross breed in cows, cattle are being replaced by buffalos for milk and draught purpose. Murrah buffalo, an indigenous breed of Haryana has much higher milk yield than indigenous cows whose rearing is becoming less and less remunerative. Sheep and goat rearing has traditionally been done by socially and economically backward communities in the state. Individually, these animals constituted only about 1.1 per cent of TLUs in the state in But their proportion in total TLUs have declined to 0.6 per cent and 0.5 per cent, respectively in 2007 (Table 2). The population of equines (namely horse, ponies, mules and donkeys) and camels in terms of TLUs has also experienced a decline from 4.0 per cent to 0.7 per cent during study period 1966 to The poultry farming has picked up in the state as its share in TLUs has increased from 0.1 % in 1966 to 2.8 % in 2007 (Table 2). It has become popular since 1980s. The success of commercial poultry farming has contributed in development of agri-business at large scale. (Please Insert Table 2 here) Composition of bovine population has undergone a drastic change during the study period (Fig. 1). The proportion of cattle has decreased consistently over the period of time as buffalo rearing became more economical under the pressure of declining size of land holding and rapid mechanization of agriculture. There is a continuous shift from the cattle to buffaloes rearing in the state. (Please Insert Fig. 1 here)
9 Growth in Livestock Annual compound growth rate of different types of livestock in terms of TLUs over different census periods has been presented in Table 3. It is evident from the Table that the growth rate of livestock units in the state has been high during the periods (3.3 per cent) and (2.7 per cent) and lowest (0.1 per cent in ). In between the periods and the growth rate slowed down. During the period there was literally no growth of livestock population. The growth rate of cattle population has been negative in the state during the period of study except , 1992 to 1997 and (Table 4). On the other hand the population of buffaloes has increased consistently though at diminishing rate but growth rate above 2 per cent since 1966 except for the period This also indicates a shift from the cattle to buffaloes rearing in the state. Sheep and goats in the state registered growth during 1970s and 1980s. TLUs of goats have also increased impressively during On the other hand, the TLUs of equines and camels have declined consistently in the state. This is attributed to mechanization of agricultural operations. Growth of Poultry and piggery appears to be moving in opposite direction as TLUs of pigs have declined while those of poultry birds have increased impressively. The most impressive growth in poultry birds was recorded during the inter census period This indicates the increasing prospects of poultry farming in the state. (Please Insert Table 3 here) Spatial Patterns of Livestock Composition There are considerable inter-district variations in composition of livestock in Haryana. Table 4 presents district-wise share of different species in terms of TLUs. It indicates that bovines constitute about 95.1 per cent of total TLUs in the state. This suggests that animals are mostly reared for milk, therefore, the state is known as land of milk production.
10 (Please Insert Table 4 here) Accounting for 83.6 per cent of total TLUs, buffalo occupies most significant place in livestock rearing in Haryana. The share of buffaloes in TLUs is higher in the districts of Jhajjar (89.9 %), Mewat (89.6%), Faridabad (89.7%) and Panipat (88.0 %) (Table 4). On the other hand Panchkula district has lowest proportion of buffalo in terms of TLUs (54.7 %) followed by the district of Sirsa and Yamunanagar which rear cows in large number. The cattle constitute about 11.5 per cent of total TLUs in the state. But there are significant inter-district variations in their distribution (Fig. 2). Sirsa, Yamunanagar and Hisar districts have high proportion of cattle TLUs i.e per cent, 19.5 per cent and 14.7 per cent, respectively. On the other hand, low proportion of TLUs is found in the districts of Mahendergarh (6.4 %), Panipat (7.3 %), Rewari (7.4 %), Mewat (7.6 %), Jhajjar (8.0 %) and Sonipat (8.8 %), respectively. As mentioned earlier sheep and goat rearing in the state has been marginalized since the inception of Green Revolution in mid 1960s. But still proportion of ovine animals is slightly higher (above 1 %) in the adjoining districts to Rajasthan in south and southwestern Haryana. Some land is available for grazing for sheep and goats in these districts. Contributing about 2.8 per cent of total TLUs, the poultry birds are unevenly distributed in the state (Table 4; Fig 2). It is evident from Table 5 that poultry birds constitute about 32 per cent of TLUs in Panchkula district. Apart from Panchkula the adjoining districts of Yamunanagar and Kurukshetra in north-eastern region has high concentration of poultry farms. Likewise, poultry birds also constitute a significant proportion of TLUs in Jind district in central Haryana, Karnal and Panipat districts in eastern Haryana and Gurgaon districts in south-eastern Haryana. It is evident from preceding discussion that the state specializes in rearing of buffaloes for milk production. The eastern parts of the state, specializing in wheat-rice cultivation also specializes in buffalo rearing. But there are also signs of livestock diversification in northeastern
11 and north-western regions. Panchkula district in northeast which has witnessed commercial poultry farming at large scale has most diversified livestock in Haryana. Furthermore, Yamunanagar and Sirsa districts also have diversified livestock as farmers in these areas rear cows in substantial number beside buffaloes. Diversification in livestock rearing has also become visible in Jind and Karnal districts as poultry farming is being taken up by farmers along with cattle and buffalo rearing. (Please Insert Fig. 2 here) Density of Livestock High density of cattle TLUs is found in Yamunanagar (60), Kurukshetra (54) and Karnal (49) districts (Fig. 3). The districts of Ambala, Kaithal, Jind, Hisar, Sirsa, Rohtak and Faridabad have moderate density of cattle TLUs (35-45). Very low density of cattle TLUs (below 25) is found in Panchkula, Fatehabad, Bhiwani, Jhajjar, Gurgaon and Rewari districts (Table 5). (Please Insert Table 5 here) Likewise, highest density of buffalo TLUs is found in Panipat (205) and Faridabad (204) districts. Other districts having high density of buffalo TLUs (above 150) include Jind, Kurukshetra, Kaithal, Karnal, Sonipat, Rohtak and Mewat (Fig. 4). On the other hand very low density of buffaloes TLUs is found in Panchkula, Sirsa and Fatehabad i.e. less than 90 TLUs. Four districts namely Ambala, Yamunanagar, Hisar and Jhajjar districts have moderate density ( TLUs). Low buffalo density ( TLUs) is found in districts of Bhiwani, Mahendergarh, Rewari and Gurgaon (Fig.4). (Please Insert Fig. 3, 4, 5, 6 and 7 here) Fig. 5 reveals that with the lone exception of Fatehabad, the districts making boundary with Rajasthan have higher concentration of sheep. The density of sheep TLUs is found to be comparatively high (more than 18 TLUs per km 2 ) in these districts of western Haryana. The
12 density of this ovine is very low (below 8 TLUs per km 2 ) in Rewari, Gurgaon, Sonipat, Panipat and Panchkula districts. The density of goats is found to be comparatively high (25 TLUs or more) in Mewat and Mahendergarh districts in southern part of Haryana and Pachkula district in northeastern part of the state (Fig. 6). Bhiwani and Rewari districts in the southwest have recorded moderate density of goats (15-25 TLUs per km 2 ). On the other hand, Jind, Kaithal, Kurukshetra and Ambala districts witnessed very low density of goats (below 5 TLUs per km 2 ). On the whole, the density of livestock in the state has been examined at district level in terms of animal-land ratio (TLUs per km 2 ) and animal-man ratio (TLUs per 1000 persons). Table 6 depicts district-wise density of livestock in 2007 in terms of TLUs. It shows that the density of buffaloes is highest (135 TLUs) followed by cattle (35 TLUs). Ovine and other animals have very low density, i.e. sheep (14 TLUs), goat (12 TLUs) and other (5 TLUs) per km 2. While livestock human ratio in terms of species-wise TLUs per thousand persons is found to be 282, 73, 28, 25 and 8, respectively for buffaloes, cattle, sheep, goats and others (Table 6). (Please Insert Table 6 and Fig. 8 here) Overall pressure of livestock on land (TLUs per km 2 ) is found to be high in two clusters, Jind and Panipat districts in central and eastern Haryana and Mewat and Faridabad districts in south-eastern part of the state. The eastern Haryana in general extending from Ambala to Rohtak with a small gap of Panipat district has recorded moderate density of livestock ranging between TLUs per km². Very low density of livestock (below 160 TLUs per km²) is found in the districts of Sirsa and Fatehabad districts in northwest, Rewari and Gurgaon in the south and Panchkula in the extreme northeast of the state. Table 6 and Fig. 8 show inter-district variation in livestock-human ratio (TLUs per thousand persons) in Haryana. The ratio is comparatively high (more than 500 TLUs) in a very large area comprising the districts of Jind, Kaithal, Fatehabad, Sirsa, Hisar and Bhiwani (Fig. 8).
13 On the other hand very low ratio is found (less than 300 TLUs) in extreme northeast (Panchkula district) and southeast (Faridabad and Gurgaon districts). There exists moderate livestock-human ratio ( ) in Kurukshetra, Karnal, Mahendergarh and Mewat districts (Fig.8). Conclusions It is evident from the study that animal husbandry in Haryana is largely oriented towards milk production with much emphasis on bovine raising and specialization in buffalo rearing. The study reveals that share of buffaloes has increased over last four decades as compared to other species of the livestock. Buffaloes account for 135 TLUs per km 2, 282 TLUs per 1000 persons and about 84 per cent of total TLUs of the state. The concentration of buffaloes is found to be high in central, eastern and southeastern parts of the state comprising districts of Jind, Kaithal, Kurukshetra, Karnal, Panipat, Sonipat, Rohtak, Mewat and Faridabad. On the other hand, cattle rearing are becoming progressively less viable as its proportion in total TLUs has declined substantially from 35.3 per cent in 1966 to 11.5 per cent in Cattle rearing in the state have got marginalized due to reduction in grazing and fallow land as indigenous cows unlike buffaloes are not stall fed. However, the density of cattle is found to be comparatively high in the districts of Yamunanagar, Kurukshetra and Karnal. Mechanization of agricultural operations has adversely affected cattle rearing in the state due declining demand for draught animals. The ovine population (sheep and goats) is the third largest category of livestock in Haryana. Sheep and goats are mostly grazed on marginal lands. Therefore, these are mostly concentrated in the dry areas along the border of Rajasthan in south-western and southern parts of the state. Reduction in grazing area and common village land are mostly responsible for absence of ovine rearing in the areas having wheat-rice cultivation.
14 Poultry birds accounted for about 3 per cent of total TLUs in the state in Introduction of modern poultry farming is changing the composition of livestock rearing in some pockets of Haryana. It constitutes about 32 per cent of total TLUs in Panchkula district. Apart from Panchkula district, it has made inroads as an agri-business in Jind, Karnal, Gurgaon, Panipat, Yamunanagar and Kurukshetra districts. It also indicates the initiation of livestock diversification in these districts. Thus, introduction of modern poultry farming is changing the composition of livestock rearing in Haryana. It is turning livestock rearing into commercial pursuit. References Devendra, C. and Thomas, D Crop animal systems in Asia: importance of livestock and characterization of agro-ecological zone. Agricultural Systems, 71: Elumalai, K. and Panday, U.K Growth and density scenario of livestock and poultry in Haryana. Indian Journal of Animal Sciences, 73 (10): FAO, FAO Statistical Databases. Food and Agriculture Organization of the United Nations, Rome. Accessed on Aug. 13, FAO, FAO Statistical Year book 2013 of World Food and Agriculture. Food and Agriculture Organization of the United Nations, Rome. Accessed on Aug. 20, Kleiber, M Body size and metabolism. Higadia, Journal of agricultural Science, 6 (11): Kumar, A. and Singh, D.K Livestock production systems in India: an Appraisal across agro-ecological regions. Indian Journal of Agricultural Economics, 63 (4):
15 Njuki, J., Poole, J., Johnson, N., Baltenweck, I., Pali P., Lokman, Z. and Mburu S Gender Livestock and Livelihood Indicators. International Livestock Research Institute (ILRI), Nairobi: Planning Commission (India) Report of the Working Group on Animal Husbandry and Dairying 12 th Five Year Plan ( ). Government of India, New Delhi: 2-5. Pratt, M. and Rasmussen, G.A Determining Your Stocking Rate. Cooperative Extension Services, Utah State University, Logan, Utah: Accessed on June 12, Rana, Z.S Livestock Wealth of Haryana. CCSHAU Publication, Hisar: Steinfeld, H., Gerber, P., Wasssenaar, T., Castel, V., Rosales, M., Haan, C.D Livestock s Long Shadow: Environment Issues and Options. LEAD and FAO, United Nations, Rome: Thammi, D.R., Prakash, M.G., Rao, S.T.V. and Reddy, M.S Socio-economic and livestock aspects of different production systems-indian case study. Livestock Research for Rural Development. Irrd.cipav.org.co/Irrd18/12/cont1812.htm. Accessed on June 12, Thornton, P.K., Livestock production: recent trends and future prospects. Philosophical Transactions of Royal Society, 365 (B):
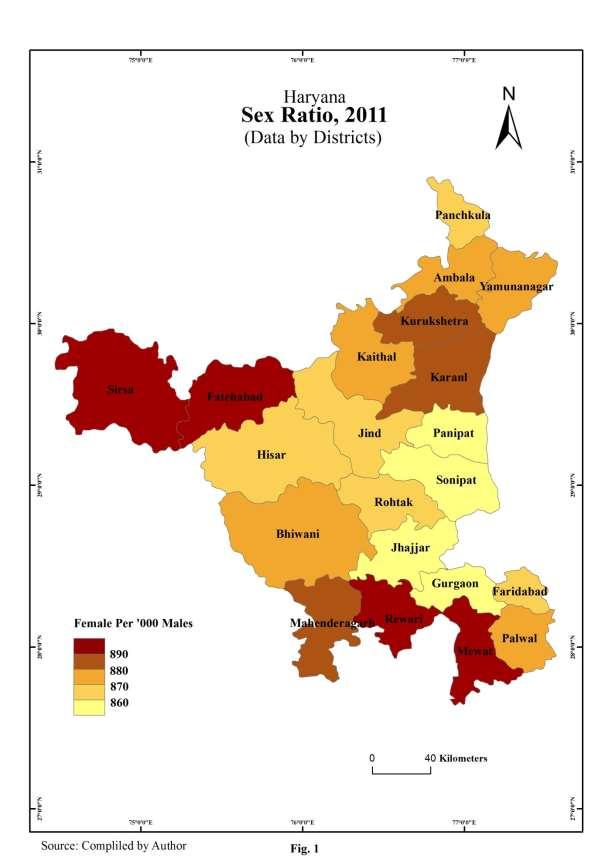
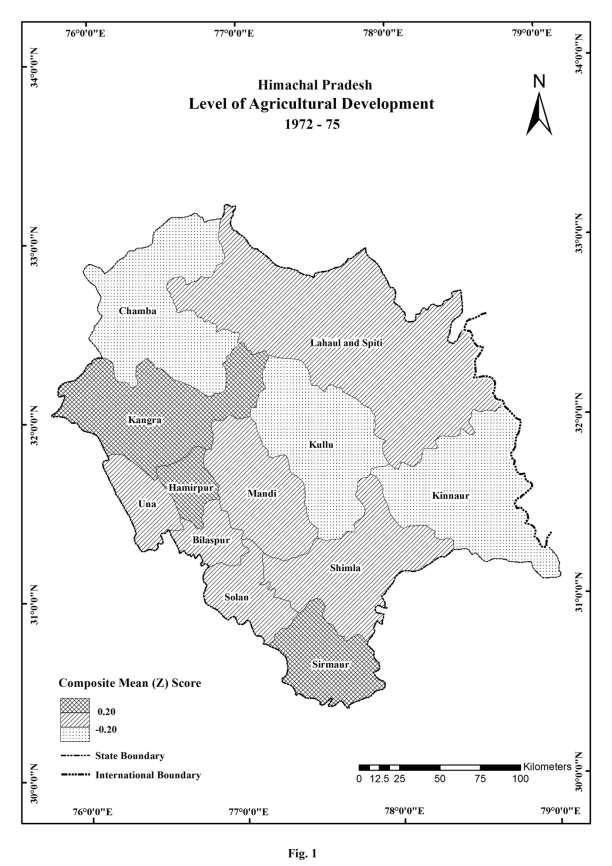
16 FORMAT FOR FIGURES PREPARATION Prepare a separate file for each figure in jpg format (300 dpi) and put these in separate folder. Do not put figures in the text file of the manuscript 1. All written work should be in Times New Roman and in running format. i.e Haryana and not in Capitals i.e. HARYANA 2. Name of the area/state/district should be at 12 pt. For example, Punjab. 3. Title of the figure should be at 14 pt. For example, Levels of Agricultural Development. It should be bold. 4. The word legend should not be written but what legend shows should be written for example, Composite Index or Percentage or Females per Thousand Males or Land use/cover 5. In case of maps, North must be mentioned but on right hand upper corner. 6. Lines of latitude and longitude must be shown but inside the margin. 7. Scale of the map must be given in the southern part of the map where the space is available. 8. Source of figure must be mentioned but just below the margin as; Source: Table 7, Source: Prepared by the author 9. Figure number must be mentioned but outside the margin as Fig.8 Example follows:
17
18
19 FORMAT FOR TABLES PREPARATION Prepare a separate file for all tables and do not put these tables in the text file of the manuscript. 1. All written work should be in Times New Roman and in running format as Haryana and not as HARYANA. 2. Font for the written work should be 12 pt. However, author can use smaller font under compulsion. 3. Name of the area to which it belongs must be written in the title of the table. 4. Source of the Table must be mentioned just below the Table. 5. Number of the table should be mentioned above the title of the table. 6. Mention in the text where a particular table is to be inserted. Example follows: Table 1 Alaknanda Watershed: Snow Cover Classes and Change Detection ( ) Snow Cover Classes NDSI Change ( ) Snow Area Snow Area Snow Area (km²) (Per cent) (km²) (Per cent) (km²) Frost Fine granular Medium granular Coarse granular Source: Landsat TM Imagery