Set-up of CGMS in Ethiopia and first user experiences
|
|
|
- Jesse Quinn
- 5 years ago
- Views:
Transcription

, Michel MASSART")
1 4th CGMS Expert Meeting (18-19 March 2009) JRC ISPRA Set-up of CGMS in Ethiopia and first user experiences Bernard TYCHON, Bakary DJABY (Ulg), Michel MASSART (JRC-FOODSEC)
2 A. Objective Adaptation of the European CGMS to an African tropical region and improvement of the model with remote sensing integration or assimilation. Extract a set of comprehensive crop growth parameters at subnational level for early forecasting/warning purposes and agricultural productions estimates
3 B. Context Activity included into the GLOBAM project (GLOBal Agricultural Monitoring systems by integration of earth observation and modelling techniques Belgian Science Policy Funded Project)
4 B. GLOBAM Model selection Four criteria were used to select the models : Model selection is directed by the number of biophysical variables calculated by these approaches that could be compared with RS derived ones. Possibility for the selected models to receive and valorise direct remote sensing information instead of intermediate calculated state or output variables. This requests an accessibility to the source codes. The selected models should also have ability to work both at (large) parcel and NUTS3 level. It should also work in the 3 different test sites. Finally, the model selection also depends on our own experience with process-oriented crop growth models. Indeed the three scientific teams implied in the selection process have a strong experience with the Mars Crop Yield forecasting System
5 B.1. Model selection : WOFOST (CGMS ) CGMS, the Crop Growth Monitoring System, used at European level since based on the photosynthesis process all the teams implied in the agrometeorological part of GLOBAM have a strong experience with this model. the model has got a calibration platform that allows, in principle, a robust calibration of the model for the three different test sites.
6 B.2. Possibilities for improving Agromet models Improving estimates of static parameter values Improving estimates of initial conditions in space and time Replacing state variables (LAI, ETa, Biomass) by input variable estimated by RS Applying sequential assimilation processes to update crop state variables Use spatio-temporal dispersion of RS-derived biophysical variables to produce probabilistic model outputs.
7 B.3. Model validation At parcel level, comparison between field biophysical variables observed and model outputs At NUTS 3 level, comparison between official stats figures (if available and reliable) and average values of fields biophysical variables in the same administrative unit. Comparison also with operational models running in the study site.


8 Area: sq.km Population: 77 million (2007) Rural : 85% Wheat area : 1.3 million ha C. Study area

9 C.1. Wheat zone (CSA 2001 census)
 21.3 ± 0.3 1310.8 ± 60.8 Dega (2300 to 3200 m) 19.0 ± 0.4 1655.7 ± 83.0 Wurch (3200 to 3700) 19.3 ± 1.2 1217.9 ± 214.")
10 Agroecological zone mean temperature ( C) Annual rainfall (mm) Bereha ( Less than 500m) 28.4 ± ± 17.9 Map source : IFPRI Atlas Kolla (500 to 1500 m) 25.5 ± ± 26.8 Woina Dega ( m) 21.3 ± ± 60.8 Dega (2300 to 3200 m) 19.0 ± ± 83.0 Wurch (3200 to 3700) 19.3 ± ± 214.5
11 D. METHODOLOGY D.1 Crop growth model WOFOST crop simulation model (van Diepen, Rappold, Wolf, and van Keulen, 1989) CGMS applications : CGMS version 9.2 CGMS has been chosen for : the database framework for model inputs and outputs; the facility for aggregation at differents administrative level; the facility to link with GIS and remote sensing data availability of differents complementary tools (CALPLAT, SANPLAT, CGMS-Statool, Pywofost)
12 D.2. WOFOST Crop Model - conversion of daily weather data into daily growth of crop biomass - many crops: Wheat, Barley, Maize, Rice, Sunflower, Rapeseed, Sugar Beet, Potato, Field Beans/Peas, Soy Beans, Pastures (Rye Grass) - Energy balance, water availability, dry matter partitioning


13 D.3. Model input Miscellaneous Data 5 4 Ethiopian vector Coverage At sub national level ECMWF dekadal data FAO World Soil map WOFOST spring wheat parameters
14 D.3.1. Weather data Source : FOODSEC Climatic database (CID portal) Parameters : average temperature maximum temperature minimum temperature precipitation sum evapo-transpiration sum (ES0, bare soil) evapo-transpiration sum (E0, over water) evapo-transpiration sum (ET0, Penman-Monteith) global radiation sum Spatial resolution : 0.5 degree grid ( 50 * 50 kms) Temporal resolution : 10-daily Temporal windows used : 1997 to 2007 Others parameters : wind speed and vapour pressure (FAO new-loclim database at monthly time scale)

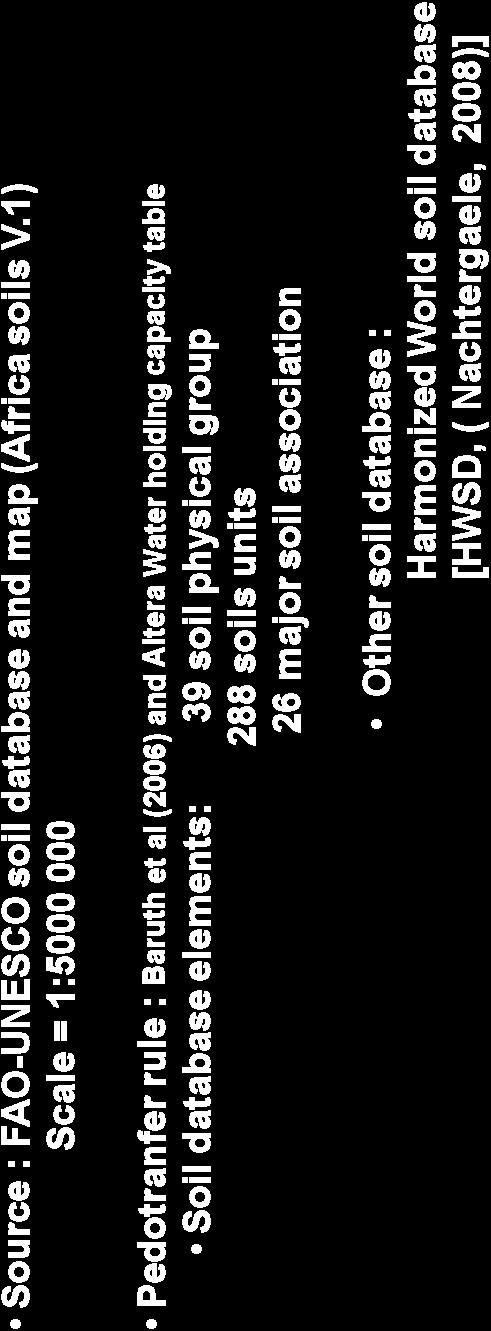

15 D.3.2. Soil database


16 D.3.3. CROP Parameters TSUM1 and TSUM2 values and coefficient of variation Variety TSUM1 TSUM2 Wheat area classification 1 20 <T mean < % % 15 <T mean < % %

17 D.3. Model input D.3.4. Ethiopia NUTS NUTS LEVEL for CGMS Ethiopia Administrative Level Number 0 Regions Zones Woreda 3 550


18 D.3. Model input D.3.5. Ethiopia NUTS 0 and 1 maps


19 D.4. Miscellanous data

20 D.4. Miscellanous data Official statistics: wheat Yield ( kg / ha) Zone Mean C.Interval Arsi Hadiya Bale East Shewa West Shewa South West Shewa East Gojam North Shewa South Wello North West Shewa North Gonder South Gonder Mean
21 kg Dry matter/ ha Ethiopia Region Water limited grain yie E. RESULTS E.1. Region level Except Addis Ababa where no real agriculture exists, CGMS water limited grain yield reaches the same level of yield as observed in official statistics and other models (CERES) at regions level Amhara Oromia SNNP Addis Ababa Regions Potential Biomass Potential grain yield Water limited biomass Water limited grain yield Addis Ababa ± ± ± 1, ± 881 Amhara ± ± ± ± 342 Oromia ± ± ± ± 205 SNNP ± ± ± ± 282 All ± ± ± ± 278

22 E.1. Region level Oromia region water limited grain yield Weak link with official stats data! ECMWF rainfall data as a probable main reason of this discrepancy
23 E.2. Zone level Regression analyses per region over all years Simple linear regression between official statistics and CGMS outputs are significant in 4 zones over 12, and water limited grain and biomass, potential grain yield and biomass explain 20 to 58% of the variability of official statistics. NUTS NAME Model RMSE R 2 Intercept slope p Arsi WB WG North Gonder WB South Gonder WG PB West Shewa PG WB WG
24 E.2. Zone level Regression analyses for one year over all regions High R-square has been obtained with spatial trend analysis in R-Square
25 E.3.Woreda level At woreda level, only one year (2001) figures has been compared and the variability observed in water limited grain and biomass are greater than what is observed in official statistics and the spatial concordance rank percentage is only 40%. N Mean±s CV Median W.L. Biomass ± % 8146 WL grain yield ± % 2081 P. Biomass ± % P. Grain yield ± % 6973 Statistics yield ± 28 32% 1206
26 F. Preliminary analysis 1. Trend observed in CGMS outputs times series is different from official statistics trend at national and zone levels. 2. CGMS outputs trends are very similar to ECMWF rainfall trend 3. Spatial ranks show a high correspondence between CGMS outputs and Official statistics in 2002, which is the year with lower total rainfall, statistics yield and CGMS outputs 4. A comprehensive database has been built for wheat in Ethiopia
27 G. Next step Model improvements by: Checking rainfall data by using an interpolated source from raingauge data Sensitivity analysis to refine phenology spatial distribution and TSUM1,TSUM2 calculation Replace the soil data with the existing 1: scale data from SOTER database Combine R.S. data with CGMS outputs Compare CGMS outputs with other well-established models (AMS)
28 H. Conclusions and perspectives First trial of CGMS in Ethiopia : possible but data accessibility remains a key problem CGMS framework offers for the African region an interesting tool to build historical databases for crop growth indicators and yield database. This database can improve identification of vulnerable zone to enhance early warning systems assessments. Model can be improved by updating parameters with actual field data and remote sensing data Wheat, millet, sorghum and maize, the most important crops in food insecure African regions, have been tested in Wofost and this experience should be used through CGMS tools to serve as crop monitoring tools also for food security and early warning purposes