Crop and Livestock Outlook and Strategies
|
|
|
- Chastity Russell
- 5 years ago
- Views:
Transcription

1 Crop and Livestock Outlook and Strategies January 2019 Western Wisconsin Ag Lender s Conference Brenda L. Boetel UW-River Falls Extension Commodity Marketing Specialist
2 Key Market Factors World and US economics Exchange rates Monetary Policy Meat demand Exports and trade policy New Congress Energy Policy African Swine Fever 2018 crop supplies 2
3 Macro conditions remain positive but times are changing World economic growth is still positive but World Bank downgraded outlook for global economy 2.9% in 2019 as opposed to 3% in 2018, 3.1% in 2017 Equity markets have been volatile Real GDP growth at 3.4% in Q3, down from 4.2% in Q2 RDPI increased 0.2% Wages are being driven by tight labor market U rate at 3.9 well below the natural rate, up from October (3.7) which was lowest since 1969 BUT THIS RECOVERY IS OLD!!!!! And we haven't had one last forever yet Likely no interest hikes in
4 Employment, production and sales peak before recession Dr. Dieli s EAS points to Jan 2019 as 1 st eligible month for recession 4
5 Government Shutdown Many USDA publications halted January 11, 2019 Reports Final size of 2018 corn and soybean crop Winter Wheat Seedlings December 1 corn stocks estimate January 24 & 25, 2019 Livestock Slaughter Cattle on Feed January 31, 2019 Cattle Export Data Market Facilitation Program payments Still going out if production evidence processed by Dec 21 Jan 15 deadline (may be extended) to sign up for MFP payments 5

6 2019 will have 208 MB increase (a 4.7% increase from 2018) 6
7 7
8 USDA DECEMBER SOYBEAN WASDE U.S. Soybean Balance Sheet (Year Beg. Sept. 1) 2016/ / /19 %Change vs 17/18 My Forecast Dec 2018/19 Acres Planted % 89.1 Acres Harvested % 88.2 Yield % 51.8 Supply Beg. Stocks % 438 Production % 4569 Imports % 25 Total Supply % 5032 Demand Crush % 2080 Exports % 1900 F/S/R % 128 Total Demand % 4107 Ending Stocks % 925 Stocks to Use Ratio % 22.5 Avg. Farm Price Soybean Oil Price Soybean Meal Price

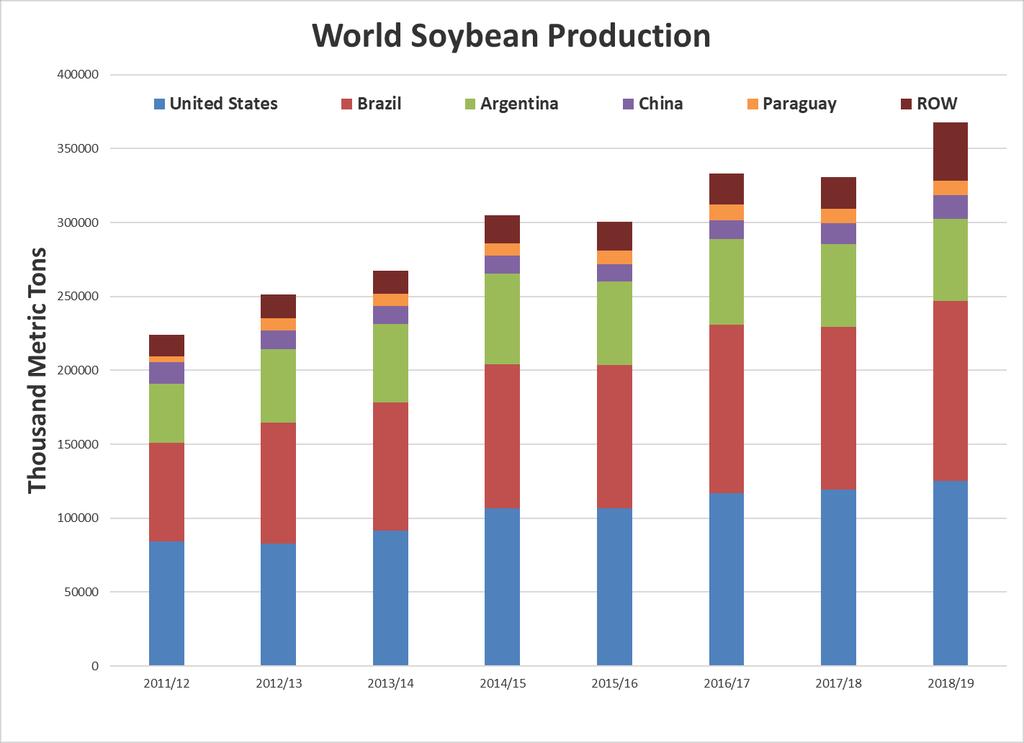
9 60% of Soybeans went to China in MY17 November usually sees US dominate soybean exports to China 0 exports in November MMY in November 2017 Brazil exports to China increased 84% in November Brazil exports stayed strong in December
10 USD Index Value of US dollar increased over last year Lower dollar is supportive of exports
11 12
12 Bullish Factors Brazilian production is likely to be cut Hot dry conditions and early beans yields are disappointing 3 MMT decrease to 119 MMT Argentina crop is lower too 1 MMT decrease to 56 MMT Most of the bearish news is incorporated into price Trade war nearing an end 13
13 Bearish Factors Inventories are so high that it limits any upward momentum 960 million bushel carryover Likely see continued large soybean acres in
14 Where will soybeans go in 2019? Fundamentals are historically bearish But this is already built into the price Surprises will be on the bullish side Trade war ending?? Will have less acres planted in
15 Where will soybeans go in 2018/19? If have 85 Million acres planted (a decrease of 4.1 million acres) Yield of 50 bu/acre Increase exports to 1980 S/U would be 11.7% - carryover of 487 MB Cash harvest price could be as high as $9.5 17
")
16 Total Supply = (16940 in 2016/17) 18

17 Corn December WASDE 19

18 Jan 11 report would give indication of feed and residual usage for Q1 Stocks hard to predict w/o final production and Q1 consumption Likely see an increase in feed and residual usage 20

19 Ethanol Production Corn used for ethanol is lower Renewable Fuel Standard waivers allowed in 2018 RFS requirements would severely harm the economy of a state or region in the US Negative margins have led to temporary shut-downs 21
20 Total Corn Export Commitments No export reported for the past two week 22
21 23
22 Bullish Factors Seasonality Improved trade with China will increase soybean acres Likely see a yr/yr decrease in corn stocks Strong quarterly exports Bearish Factors Negative ethanol margins and shuttered operations 24

23 Neutral conditions but with an El Nino watch are expected to continue (65-75% chance) in Northern Hemisphere through summer El Nino winter means milder with less snow for our region and 25 cooler and wetter summer


24 Jan Jan Least amount of drought in very long time 26
25 Jan-07 May-07 Sep-07 Jan-08 May-08 Sep-08 Jan-09 May-09 Sep-09 Jan-10 May-10 Sep-10 Jan-11 May-11 Sep-11 Jan-12 May-12 Sep-12 Jan-13 May-13 Sep-13 Jan-14 May-14 Sep-14 Jan-15 May-15 Sep-15 Jan-16 May-16 Sep-16 Jan-17 May-17 Sep-17 Jan-18 May-18 Sep-18 Jan Soybean/Corn Ratio
26 Where will corn go in 2018/2019? Likely trade up until mid-may Dry weather in Southern Plains depressing winter wheat seedings Limited upside potential for price To make a move up need bullish news, but most of bearish news already incorporated Ukraine grain exports up 12% in first half MY 19 In spring dependent on acreage and mother nature Likely see an increase in acreage Trend yield of 176 bu/acre Increase current demand to 15.1 bb Have a stocks to use ratio of 10.8% (compared to current 11.8%) 28
27 Where will corn go in 2019? Yield of 176 bu/acre Demand of 15.1 BB If have 89 Million acres planted S/U would be 9.6% Cash harvest price could be as high as $4.00 If have 91 Million acres planted S/U would be 11.8% Cash harvest price could be as low as $
 Oct first month since Jan 18 with yr/yr decrease 2019 projections lowered due to decreased weights Exports highest since Oct 2013 Turkey production down on daily")
28 Oct 18 broiler production 3.9B lbs (0.4%+) Oct first month since Jan 18 with yr/yr decrease 2019 projections lowered due to decreased weights Exports highest since Oct 2013 Turkey production down on daily basis by 1% compared with production up 2% over will be up 0.3% over 2018 Exports were 3% higher yr/yr in Oct 31
 and China/Hong Kong (-44.")
29 4 th year of record production slightly greater than 7 B lbs. Adjusting to expanded processing capacity Export between 22 25% of production Mexico (-3.9% mo/mo) and China/Hong Kong (-44.4% mo/mo) are lower yr/yr Tariffs make US pork imported by China more expensive than other countries Mo/Mo 2018 exports up 1.5% 32

30 Production up 13% over 2015 likely increase another 2% in 2019 Beef exports up 11% in rd year with double digit growth 2019 likely see a 6% increase in exports 33

31 USDA ERS Livestock, Dairy and Poultry Outlook Sept

32 Consumer expenditures in 2018 increased Macro economic conditions play into increase Jan-Jun 2018 saw stable demand weakened 2.5% since July Export demand has off-set weaker domestic demand Likely see lower casual dining restaurant growth in


33 Herd Stability? Female slaughter up and retention down Heifers were 35.5% of fed cattle slaughter Beef cow cull rate was 9.8% Likely see herd inventory peak in 2019 Beef cow inventory at 31.9 Mhead in Jan calf crop will be 1% larger than 2017 Feedyard placement will grow in 2019 with larger feeder cattle supply Beef production will peak in beef production will be up 2% in
34 Where are we headed? Continued expansion in all 3 major proteins Record protein production of B lbs Stronger global demand is critical to keep per-capita consumption near forecasted levels African Swine Fever may create global protein shortage Growing supplies will decrease producer leverage Profit margins will decline for producers Processors will see larger margins Fed cattle will see losses in first half 2019 Fed cattle producers gain leverage over feeder producers Need to focus on measuring and managing input costs 37
35 Watch List for 2019 Trade need for bilateral agreement with Japan How long with trade war with China last? Economy Recession? Energy Policy RFS waiver allowance Lab-created meat Regulations on synthetic meat will be implemented in 2019 Immigration Reform Consolidation Farms to coops Regulations WOTUS
36 Questions or Comments?