World Agricultural Outlook Board Interagency Commodity Estimates Committee Forecasts. Lockup Briefing March 10, 2014
|
|
|
- Laureen Heath
- 5 years ago
- Views:
Transcription
1 World Agricultural Outlook Board Interagency Commodity Estimates Committee Forecasts Lockup Briefing
2 World Wheat Production Country or Region 2013/14 Million Tons World United States Foreign Argentina Canada Australia European Union Russia Ukraine Kazakhstan China India
3 Million tons 14 Ukraine Wheat Exports July-June Year Wheat Exported Projected Additional Exports (March thru June) 7.4* / / / / /14 P * Estimated shipments for July 2013 through Source: USDA-FAS, Office of Global Analysis, Grains: World Markets and Trade,,
4 U.S. Wheat Supply and Demand 2013/14 Planted area (million acres) Harvested area (million acres) Yield (bushels per acre) Million bushels Beginning stocks Production 2,266 2, Imports Total supply 3,131 3, Food use Seed Feed and residual Domestic use 1,406 1, Exports 1,007 1, Total use 2,414 2, Ending stocks Stocks to use ratio Dollars per bushel Average market price /
5 World Rice Production Country or Region 2013/14 Million Tons World United States Foreign Brazil Egypt Bangladesh Cambodia China India Indonesia Japan Sri Lanka Pakistan Philippines Thailand Vietnam
6 World Rice Supply and Use 2013/14 Million Tons, milled Beginning stocks Production Total Supply Total use Trade Ending Stocks
7 U.S. Rice Supply and Demand Rough Equivalent of Rough and Milled Rice 2013/14 Planted area (million acres) Harvested area (million acres) Yield (pounds per acre) 7,449 7, Million cwt Beginning stocks Production Imports Total supply Domestic use Exports Total use Ending stocks Stocks to use ratio Dollars per cwt Average market price /
8 World Corn Production Country or Region 2013/14 Million Tons World United States Foreign Argentina Brazil Mexico Canada European Union FSU Ukraine Russia South Africa China India
9 Ukraine Corn Exports October-September Year Million tons Corn Exported Projected Additional Exports (March thru Sept.) / / / / /14 P * Estimated shipments for October 2013 through * Source: USDA-FAS, Office of Global Analysis, Grains: World Markets and Trade,,
10 U.S. Corn Supply and Demand 2013/14 Planted area (million acres) Harvested area (million acres) Yield (bushels per acre) Million bushels Beginning stocks Production 10,780 13, Imports Total supply 11,932 14, Feed and residual 4,335 5, Food, seed, and industrial 6,044 6, Ethanol 4,648 5, Domestic use 10,379 11, Exports 731 1, Total use 11,111 13, Ending stocks 821 1, Stocks to use ratio Dollars per bushel Average market price /
11 U.S. Sorghum Supply and Demand 2013/14 Planted area (million acres) Harvested area (million acres) Yield (bushels per acre) Million bushels Beginning stocks Production Total supply Feed and residual Food, seed, and industrial Domestic use Exports Total use Ending stocks Stocks to use ratio Dollars per bushel Average market price /
12 Million tons World and China Sorghum Imports October-September Year China Rest of World 2001/ / / / /14 P Source: USDA-FAS, Office of Global Analysis, Grains: World Markets and Trade,,
13 Million tons World and China Sorghum Imports October-September Year China Mexico Japan EU Rest of World 2001/ / / / /14 P Source: USDA-FAS, Office of Global Analysis, Grains: World Markets and Trade,,
14 $ per bushel Corn and Sorghum Gulf Bids Louisiana Export Elevators for Barges 30-day Delivery Corn Sorghum /4/ /4/2012 3/4/2013 6/4/2013 9/4/ /4/2013 3/4/2014 Source: USDA-AMS, Market News, Livestock and Grain Market News Portal,
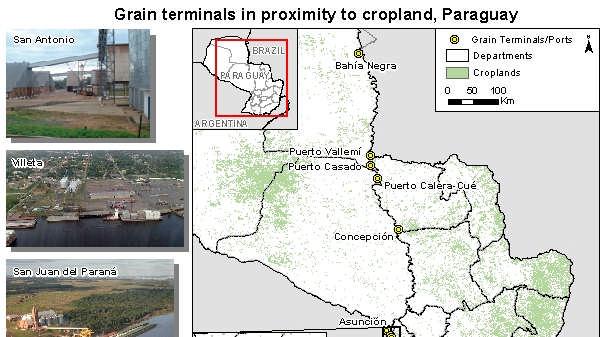
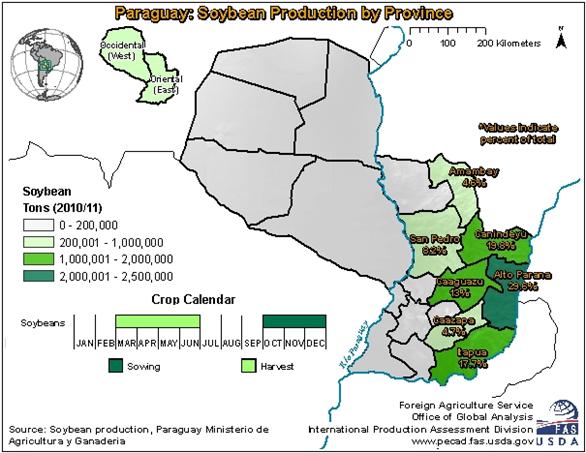
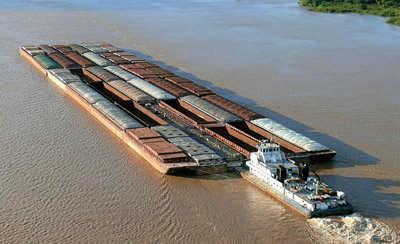
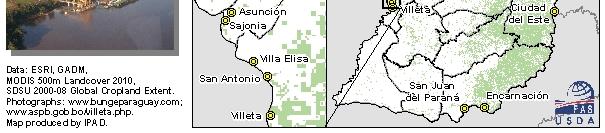
15 World Soybean Production Country or Region 2013/14 Million Tons World United States Foreign Argentina Brazil Paraguay Ukraine India China


16 Para Maranhao Piaui Rondonia Tocantins Mato Grosso Bahia Very Wet! Goias Minas Gerais Erratic Rainfall, Occasional Warmth PARAGUAY Mato Grosso do Sul Parana Sao Paulo Soybean Production *Average ( ) Recent Periods of Stressful Weather Rio Grande do Sul Santa Catarina Minor Production Intensity Major *Source: IBGE Agricultural Weather Assessments World Agricultural Outlook Board


17 Brazil: FAS Crop Travel in Rio Grande do Sul Tall healthy soybeans prior to the hot/dry Soybeans received multiple applications of pesticides to prevent Oldworm Bollworm. Photo: Chevy Spin in soybean field. Jan. 29, 2014 near Soledade, RS Photo: Pesticide applicator tracks in soybean field. Jan. 29, 2014 near Soledade, RS USDA Foreign Agricultural Service Robert Tetrault (202)
18 Brazil Soybean Area, Yield, and Production Conab Conab w/ Alt. minus Alt. Conab State ests. State ests. STATE 2004/ / / / / / / / / / /14 diff Mato Grosso Area (Mil. Ha.) Yield (Tons\Ha.) Prod (Mil. Tons) Goias Mato Grosso do Sul Federal District Area Yield Prod Area Yield Prod Area Yield Prod Center West Region Area Yield #DIV/0! Prod Rio Grande do Sul Parana Santa Catarina South Region Area Yield Prod Area Yield Prod Area Yield Prod Area Yield #DIV/0! Prod
19 Elements: Average Temperature, Days >=35 C, Precipitation, Days Between Rainfall Rio Grande do Sul: Jan, Feb, *Mar (r 2 =.99) Estimated yield: 2.45 mt/ha Parana: Dec, Jan, Feb (r 2 =.92) Estimated yield: 2.78 mt/ha * Average values used for March Agricultural Weather Assessments World Agricultural Outlook Board
20
21 U.S. Soybean Supply and Demand Planted area (million acres) Harvested area (million acres) Yield (bushels per acre) Beginning stocks Production Imports Total supply Crush Seed and residual Domestic use Exports Total use Ending stocks Stocks to use ratio Average market price 2013/ Million bushels ,034 3, ,239 3,464 1,689 1, ,779 1,789 1,320 1,530 3,099 3, Dollars per bushel /
22 World Cotton Production Country or Region 2013/14 Million Bales World United States Foreign Argentina Brazil Turkey Syria Australia China India Pakistan Uzbekistan African Franc Zone
23 U.S. Cotton Supply and Demand Planted area (million acres) Harvested area (million acres) Yield (pounds per acre) Beginning stocks Imports Production Total supply Mill use Exports Total use Unaccounted Ending stocks Stocks/use Average market price 2013/ Million bales Cents per pound /
24 Mexico Sugar Supply and Demand 2013/14 Thousand MT Beginning stocks Production Imports Total Supply Domestic use Exports Total Use Ending stocks 966 6, ,158 4,726 1,972 6,698 1,460 1,460 6, ,036 4,690 2,399 7,
25 U.S. Sugar Supply and Demand 2013/14 1,000 short tons, raw value Beginning Stocks Production Beets Cane Imports TRQ Re-export Mexico High-tier Total Supply Exports Domestic deliveries Total use Ending stocks 1,979 8,981 5,076 3,905 3, , , ,750 12,024 2,160 2,160 8,715 5,025 3,690 3,184 1, , , ,051 12,376 1, Stocks/use ratio
26 U.S. Meat Production and Prices Production Beef Pork Broilers Turkey Total meat Prices Steers Hogs Broilers Turkey Billion pounds Dollars/cwt Cents/lb
27 States with Cases of PEDv WA MT ME ND MN OR ID WI SD NY MI WY NV PA IA NE OH UT CA IL IN WV CO KS MO VA KY NC TN AZ OK NM AK SC MS TX AK AL GA LA FL HI Week of 4/15/2013: 1 state Source: National Pork Producers Council
28 States with Cases of PEDv WA MT ME ND MN OR ID WI SD NY MI WY NV PA IA NE OH UT CA IL IN WV CO KS MO VA KY NC TN AZ OK NM AK SC MS TX AK AL GA LA FL HI Week of 2/17/14: 25 states Source: National Pork Producers Council
29 01/04/14 01/18/14 02/01/14 02/15/14 03/01/14 03/15/14 03/29/14 04/12/14 04/26/14 05/10/14 05/24/14 06/07/14 06/21/14 07/05/14 07/19/14 08/02/14 08/16/14 08/30/14 09/13/14 09/27/14 10/11/14 10/25/14 11/08/14 11/22/14 12/06/14 12/20/14 Million Head Weekly Hog Slaughter
30 U.S. Meat Trade Million Pounds Beef Pork Broilers Turkey Mature Chickens Total meat Beef Exports 2,583 2,435 4,992 5,085 7,364 7, ,812 15,949 Imports 2,250 2,
31 U.S. Milk Supply and Demand Dollars/cwt Average market price 1/ Class III Class IV All milk / Prices are mid-point of published s; milk of average fat test Production Imports Commercial use Exports Billion pounds
32 U.S. Dairy Product Prices Product prices Cheese Butter Nonfat dry milk Dry whey Class prices Class III Class IV All milk Dollars/pound Dollars/cwt
33 U.S. Production Summary Crops and Products Wheat (Million bu) Rice (Million cwt) Corn (Million bu) Sorghum (Million bu) Barley (Million bu) Oats (Million bu) Soybeans (Million bu) Soybean oil (Million lbs) Soybean meal (Thousand s.t.) Cotton (Million bales) Sugar (Thousand s.t., raw value) 2013/14 2, , ,034 19,820 39, ,981 2, , ,289 19,720 40, , Milk (Billion lbs) Meat (Billion lbs) Beef Pork Broilers Turkey Total Meat
34 Domestic Demand Summary Crops and Products Wheat (Million bu) Rice (Million cwt) Corn (Million bu) Sorghum (Million bu) Barley (Million bu) Oats (Million bu) Soybeans (Million bu) Soybean oil (Million lbs) Soybean meal (Thousand s.t.) Cotton (Million bales) Sugar (Thousand s.t., raw value) 2013/14 1, , ,779 18,686 29, ,750 1, , ,789 18,550 29, , Milk (Billion lbs) Meat (Billion lbs) Beef Pork Broilers Turkey Total meat
35 U.S. Export Summary 2013/14 Crops and products Wheat (Million bu) Rice (Million cwt) Corn (Million bu) Sorghum (Million bu) Barley (Million bu) Soybeans (Million bu) Soybean oil (Million lbs) Soybean meal (Thousand s.t.) Cotton (Million bales) 1, ,320 2,164 11, , , ,530 1,500 10, Meat (Million lbs) Beef Pork Broilers Turkey Mature Chickens Total meat 2,583 4,992 7, ,812 2,435 5,085 7, ,
36 Price Summary Crops and products Wheat ($/bu) Rice ($/cwt) Corn ($/bu) Soybeans ($/bu) Soybean oil ( /lb) Soybean meal ($/s.t.) Cotton ( /lb) Livestock Steers ($/cwt) Hogs ($/cwt) Broilers ( /lb) Turkeys ( /lb) Dairy products Cheese Butter Nonfat dry milk Dry whey Milk classes Class III ($/cwt) Class IV ($/cwt) All milk ($/cwt) 2013/