2019 Michigan Milk Market Situation and Outlook
|
|
|
- Malcolm Wade
- 5 years ago
- Views:
Transcription

1 2019 Michigan Milk Market Situation and Outlook Christopher Wolf Agricultural, Food and Resource Economics Michigan State University October 11,
2 Michigan Farm Milk Financial Situation 2018 is fourth consecutive year of low milk US farm milk prices Michigan farm milk prices lowest in US because of production/processing balance 2

3 July 2018 Mailbox Milk Price Source: Hoard s Dairyman 3

4 Michigan Dairy Farm Profitability Year Milk Price $/cwt ROE % ROA % OPM % ATO %
5 lbs/person/year Total per capita consumption milk equivalent: milkfat basis
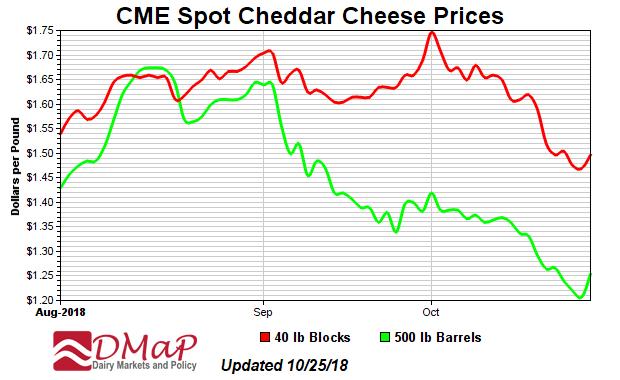
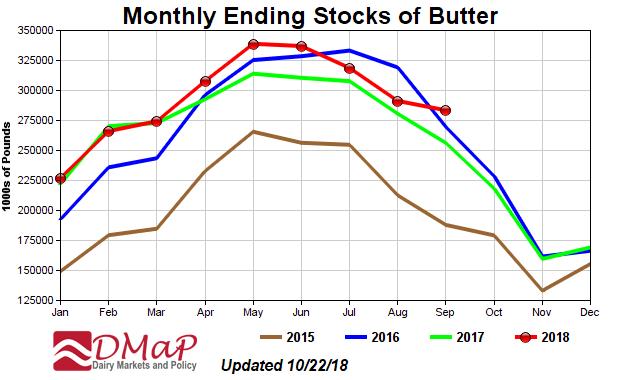
6 US Milk Component Prices Global milkfat consumption strong and supplies relatively tight US butterfat prices are driven by domestic issue Global milk protein supplies long US skim milk prices driven by world markets 6
7 lbs/person/year fluid lbs/person/year Per capita consumption dairy products Yogurt Butter Cheese Frozen Fluid 7
8 Farm Milk Price is Composed of: 1. Federal Milk Marketing Order prices Minimum prices Pooling/uniform price 2. State & Regional Market Aspects Cooperative and State/Region Issues Balancing Premiums 3. Farm Specifics Components Quality Hauling
9 9
10 10
11 11
12 12
13 13
14 14
15 15
16 16
17 17
18 18
19 19


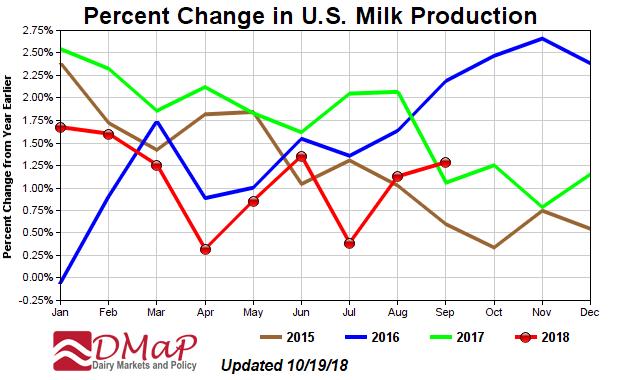
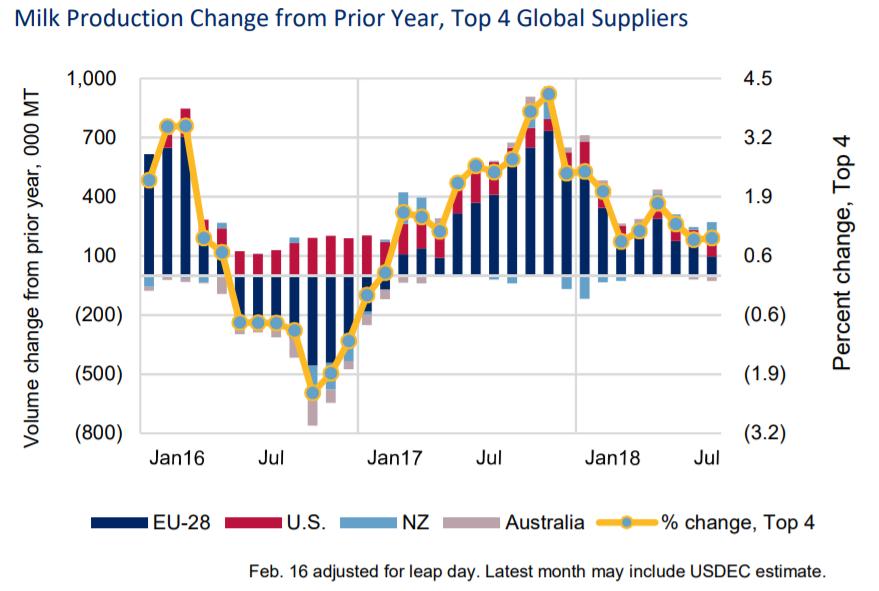
20 2018 Milk Production first 8 months: US +1.1% EU +1.5% NZ +5.5 AU -3.9 In Australia and parts of EU drought resulted in forage shortages 20
21 21
22 22
23 Milk Market Coordination The process by which supply and demand production and sales find a balance Difficult for milk because it is perishable, bulky, and must be sold daily Price plays a key role but other factors are important including physical impediments to delivery, natural variations in production and use, and business relationships Source: A.M. Novakovic
24 Milk Market Coordination Challenges Seasonal Balancing Managing counter-seasonal milk production and demand Daily Balancing Managing demand and supply shocks day-today Cyclical Balancing Coordinating over long-run cycles
25 Long-run Cyclical Balancing Growth in Michigan in past two decades reverses long-term declines Corresponds to growth in export markets Requires major investments in plants that can be commercially viable to supply world markets 25
26 Jan-1930 Jan-1933 Jan-1936 Jan-1939 Jan-1942 Jan-1945 Jan-1948 Jan-1951 Jan-1954 Jan-1957 Jan-1960 Jan-1963 Jan-1966 Jan-1969 Jan-1972 Jan-1975 Jan-1978 Jan-1981 Jan-1984 Jan-1987 Jan-1990 Jan-1993 Jan-1996 Jan-1999 Jan-2002 Jan-2005 Jan-2008 Jan-2011 Jan-2014 Jan-2017 Thousand cows Million lbs 1200 Michigan Milk Cows and Production cows milk
27 Excess Milk Production When milk supply is long or does not make it to a plant there are two possibilities: Distressed milk sales: sold at a deep discount Dumped milk 27
28 Distressed Milk Sales Sometimes a portion of milk is sold at a deep discount or to an alternative customer These transactions are almost always initiated by a supplying cooperative. Discounts tend to be 30-70% of Class III or IV price 28
29 Dumped Milk 0.2 to 0.4% of milk produced does not make it to the plant or is rejected because it is contaminated or spoiled. Plant issues (breakdowns, maintenance) can result in spoiled and dumped milk 0 to 2% of milk is sometimes dumped for lack of a market. May not leave the farm. 29
30 Pounds of Milk Milk Dumped Mideast Order (pounds) Jan Feb Mar Apr May Jun Jul Aug Sep Oct Nov Dec Average
31 % milk dumped Jan Feb Mar Apr May Jun Jul Aug Sep Oct Nov Dec Mideast Ave Mideast Ave Northeast Average Northeast Ave
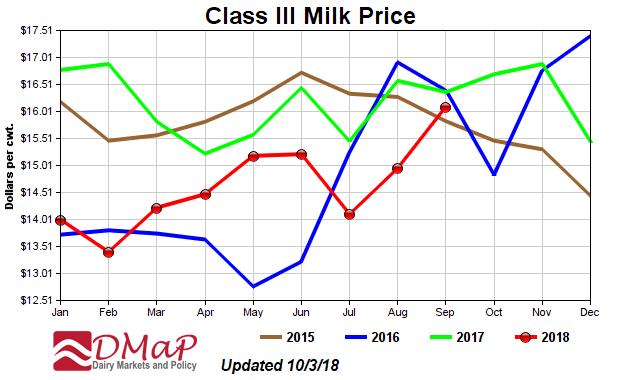
32 $/cwt MI Mailbox - Class III Avg Avg since Michigan Mailbox Class III US All Milk
33 Jan-2013 March-2013 May-2013 July-2013 Sept-2013 Nov-2013 Jan-2014 March-2014 May-2014 July-2014 Sept-2014 Nov-2014 Jan-2015 March-2015 May-2015 July-2015 Sept-2015 Nov-2015 Jan-2016 March-2016 May-2016 July-2016 Sept-2016 Nov-2016 Jan-2017 March-2017 May-2017 July-2017 Sept-2017 Nov-2017 Jan-18 Mar-18 May-18 Jul-18 Production (million lbs/day) Price difference ($/cwt) production capacity MI price - US price 33
34 Dairy Policy Issues NAFTA 2.0 California Milk Marketing Order Farm Bill Risk management programs 34
35 Dairy and NAFTA 2.0: 1. Eliminate Canada Class 7 Before Class 7 system, US had milk protein price advantage Under Class 7, Canadians had price advantage and used it to displace US sales and begin exports to third countries (at below US prices). Under NAFTA 2.0 cost will be similar, competitive advantage will derive from transportation and lower processing costs Canada agrees to cap their exports of various powders 35

36 NAFTA 2.0: Increased access to Canadian Market Canada agrees to a higher market access for US products. Once market access amounts are reached, tariffs are incurred as happens now. Quantities will increase annually in accord with market growth, for a period of time. This will phase in during 2019 There is no automatic sunset provision. 36

37 CA Order begins Oct 17, 2018
38 2018 (2019?) Farm Bill MPP-Dairy from 2014: government program that allows protection of all milk price less feed cost using US averages at fixed premiums Paid an average of $0.62/cwt on first 5 million lbs in 2018 New version increases margin to $9 for a low premium $0.17/cwt premium 38
39 Margin Protection Program 2018 All Milk Feed Cost Margin Net Payment $/cwt January February March April May June July August September October November December Average
40 For 5 million lbs in Tier 1, 2018 Note: $8/cwt coverage Premium =$0.142/cwt Payment Gross Monthly Net Monthly $ $ , , , , , , , , , , , , , , Average 2, , Total 31, ,
41 41
42 2019 Farm Bill Dairy Subtitle: MPP Replacement Policy Details Extend program through 2023 Maintain existing production history calculation (highest of 2011, 2012, or 2013) Eliminate minimum 25% production history coverage requirement Add covered margin levels of $8.50 and $9.00.cwt 42
43 2019 Farm Bill Dairy Title MPP Name Senate Dairy Risk Management Program House Dairy Risk Coverage Program Coverage decision timing Allows annual decisions One decision for entire 5 years Premiums Increase premiums on lower coverage and Tier II; Discounts premiums for small (<2 mil lbs) and medium herds (2-10 mil lbs) Lowers premiums for Tier I and increases for Tier II Feed cost formula Status quo Increases feed cost LGM participation Not allowed Allowed 43
44 Dairy Farm Risk Management Programs and Policies LGM-Dairy: insurance program that that protects class III milk price less feed costs using futures and options prices Dairy Revenue Protection (Dairy RP): new program on sale October 9. Covers the difference between final revenue guarantee and actual milk revenue a quarter of the year. Basket of milk price put options with payment adjusted by yield and protection factors
 Month 1 of Quarter Month 2")
45 45 How is milk priced? Expected Prices E.g. Class III Milk, Q Milk and Dairy Product Futures (CIII, CIV, Butter, Cheese, Dry Whey) Month 1 of Quarter Month 2 of Quarter Price Used in Dairy-RP Month 3 of Quarter $16.50 $16.45 $16.34 $16.43
46 Source: Marin Bozic, University of Minnesota 46
47 47
48 $/cwt 2019 Michigan Mailbox Average Worst Positive 48
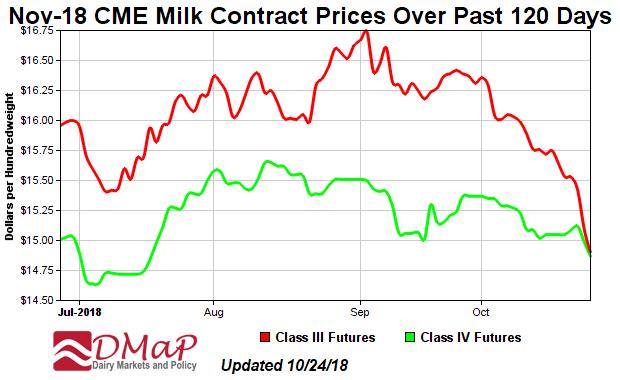
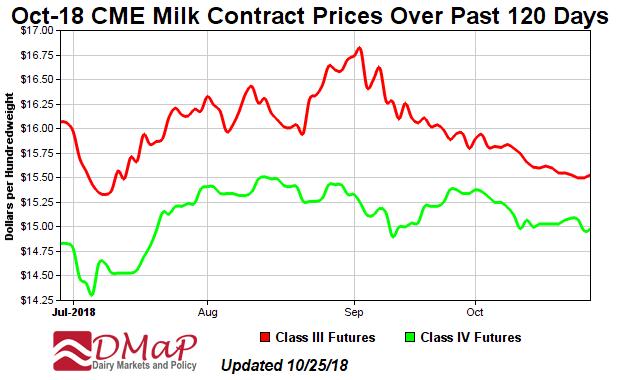
49 2019 Milk Price Forecast Price CME Futures USDA Class III $15.95 $ Class IV $15.60 $ US All Milk $ Michigan mailbox $
50 Conclusions Tighter world supplies leave US milk markets one supply shock from higher prices More of the same in 2019 for processing and Michigan basis issues 2019 Farm Bill may provide significant payments 50