2013 Half Year Results
|
|
|
- Dwain Powers
- 5 years ago
- Views:
Transcription

1 2013 Half Year Results Basel: July 24, 2013
2 Safe harbor This document contains forward-looking statements, which can be identified by terminology such as expect, would, will, potential, plans, prospects, estimated, aiming, on track and similar expressions. Such statements may be subject to risks and uncertainties that could cause the actual results to differ materially from these statements. We refer you to Syngenta's publicly available filings with the U.S. Securities and Exchange Commission for information about these and other risks and uncertainties. Syngenta assumes no obligation to update forward-looking statements to reflect actual results, changed assumptions or other factors. This document does not constitute, or form part of, any offer or invitation to sell or issue, or any solicitation of any offer, to purchase or subscribe for any ordinary shares in Syngenta AG, or Syngenta ADSs, nor shall it form the basis of, or be relied on in connection with, any contract there for. 2
3 First half 2013 highlights Continuing business momentum Underlying integrated sales up 7 percent* - growth across all regions Emerging markets: rapid expansion - sales up 11 percent* Lower royalty income, higher seeds production costs Continued progress on integrated offers On track for market share gain Underlying: excludes $256 million corn rootworm trait royalty income in 2012 * At constant exchange rates 3
4 First half 2013: integrated business update by region North America: +4%* Corn plantings near record levels Late season delayed applications Crop protection sales +9% Europe, Africa & Middle East: +6% Dynamic growth in CIS, SE Europe France: expansion of leading herbicides EU North: cold wet weather delayed season, reduced disease pressure Latin America: +12% Low season Buoyant glyphosate market Grower sentiment remains strong Asia Pacific: +8% Sales momentum building Early monsoon in India Strong growth in Thailand, Indonesia, China * Excludes $256 million corn rootworm trait royalty income in 2012 Growth at constant exchange rates 4
5 Addressing grower challenges Integrate Innovate Leveraging combined field force Integrated offers for yield, quality and convenience Breakthrough innovation Outperform 5
6 John Ramsay Chief Financial Officer
7 Financial highlights Sales $8.4bn, up 2% Underlying integrated sales up 7%* - +4% volume, +3% price EBITDA 3% lower at $2.2bn; underlying up 9% - margin 26.0% (H1 2012: 24.9% underlying) Net income $1.4bn, 5% lower EPS**: 7% lower at $15.92; underlying up 9% Underlying: excludes $256 million corn rootworm trait royalty income in 2012 * At constant exchange rates ** Fully diluted basis, excluding restructuring and impairment All 2012 and 2011 data in this presentation reflect a change in pension accounting where applicable 7
8 Crop protection portfolio: first half sales up 7 percent 1 st half sales $bn 6 CAGR +7% Selective herbicides Selective herbicides +4%: corn and cereal herbicides USA, Europe Non-selective herbicides +26%: TOUCHDOWN volume and price 4 Non-selective herbicides Fungicides +4%: SEGURIS in Germany; AMISTAR in Brazil, Asia Pacific 2 0 Growth at constant exchange rates Excludes Other (2013: $50m) Fungicides Insecticides Seed care Insecticides +1%: Americas up; Europe, Asia Pacific lower Seed care +20%: CRUISER expansion Brazil, Asia Pacific; VIBRANCE launch 8
9 Seeds portfolio: first half sales 6 percent lower 1 st half sales $bn 2 CAGR +8% Vegetables DFC Underlying sales up 6% Corn: - North America: lower royalty income, reduced hybrid availability - growth in Asia Pacific, Latin America, Europe 1 0 Corn and soybean Soybean: US RR2 transition Sunflower: strong growth CIS, South East Europe Sugar beet: lower CIS acreage; sales doubled in China Vegetables: returning to growth Underlying: excludes $256 million corn rootworm trait royalty income in 2012 Growth at constant exchange rates 9


10 Acquisition of Maize Research Institute (MRI) in Zambia Diverse white corn germplasm portfolio >1000ha of production fields Creation of corn seed hub to serve East Africa Further opportunity in wheat and soybean Leading distributor of crop chemicals and seeds Supports commitment to build $1bn business in Africa by
11 2013 second half outlook 2 nd half EBITDA contribution % 40 Second half contribution to earnings increasing Latin America fundamentals positive 20 Expanding leadership in Asia Pacific Acceleration of underlying sales growth Growth in underlying earnings Substantial free cash flow As reported 11
12 John Atkin Chief Operating Officer
13 CIS vs. EU: higher acreage but lower productivity Wheat Yield t/ha Area Mha Corn Yield t/ha Area Mha Sunflower Yield t/ha +224% CIS CIS 23 EU +70% EU +62% Yield differences reflect low CIS intensity Intensification driving higher ROI Increasing meat production fuels demand for grain Grain exports expected to grow Area Mha 13 2 CIS Source: Syngenta estimates EU 13
14 CIS: a transformational decade Sales by country $m Sales by business $m CAGR: 23% CAGR: 23% Syngenta market leadership driven by broad portfolio CAGR: 8% 500 CAGR: 32% 500 CAGR: 43% > 850 employees in 2013 (doubled since 2007) Rest of CIS Ukraine Russia CAGR: 22% Seeds Crop Protection CAGR: 17% Emergence of leading seeds technology 14
15 Long term target: 2020 sales $1.5bn CIS sales by business $m CAGR: 9% Seeds Crop Protection Cereals: seeds footprint expansion, seed care and fungicide intensification Corn: introduction of new adapted varieties CIS 2020 sales by crop Vegetables/ Specialty Cereals Sugar beet: increasing seed care penetration, meeting rhizoctonia challenge Corn Diverse Field Crops Oilseeds: leveraging seeds strength, realizing yield potential 15
16 Davor Pisk Chief Operating Officer
17 Diverse Field Crops: significant market opportunity 2012 DFC global acreage and grower spend per hectare* Total acreage Sunflower ~25Mha Oilseed rape ~34Mha Sugar beet ~5Mha Syngenta not present 7 Acreage, Mha Spend, $ per ha * Spend per hectare includes total spend on seed, crop protection and seed care Source: USDA, Informa Economics, European Commission, Syngenta analysis 17
18 Vegetable oil demand driven mainly by food and biofuels Global vegetable oil production by oil type Mt Other* Sunflower oil Rapeseed oil Soybean oil Palm oil 5% 9% 15% Global vegetable oil consumption forecast by use Mt % 12% 7% 81% 3.3% Other industrial** Biofuels Food Rapeseed, sunflower oil production adjust annually to balance demand High soybean oil production due to the by-product of soybean meal which represents 80% of animal feed Palm oil production driven by the low cost of planting palm trees: 85% in Indonesia and Malaysia Food: population and GDP growth in China and India to make up 40% of total demand in 2025 Biofuels: driven mainly by official initiatives with incentive structures (especially EU, USA, Brazil) Other industrial: driven by oleochemicals used to produce fatty acids Source: LMC Oilseed & Oil report, Syngenta analysis * Other includes corn, coconut, groundnut, cottonseed, palm kernel oil ** Other industrial include oleochemicals, feed and other non food/fuel uses 18


19 Diverse Field Crops: significant growth by 2020 Sales $bn CAGR: 7.4% Sunflower: drive leadership 2 CAGR: 10% Oilseed rape: achieve scale Sugar beet: grow profitably 1 CAGR: 5% CAGR: 5%
20 Sunflower growth demonstrates leading portfolio 1 st half sunflower seed sales $m 400 Superior germplasm, blockbuster hybrids CAGR +26% Focused portfolio of products Early anticipation of market trends: IMI integrated offer Advanced go-to-market strategy Growth at constant exchange rates 20
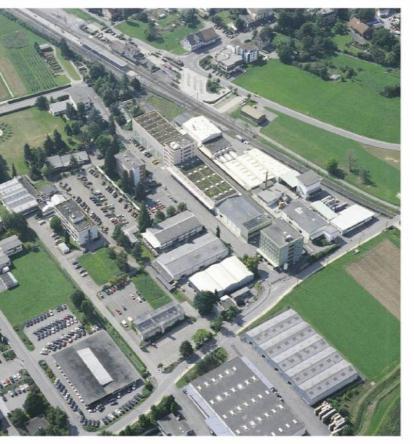
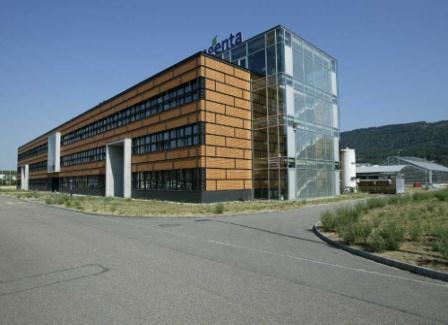
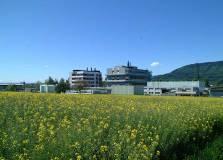
21 Mike Mack Chief Executive Officer
22 Long term drivers: current yield growth rates inadequate Production Mt/year Required yield Yield % 3 Need to double global food production by population, diet, biofuels % Current yield 0.9% 1.0% 1.6% Soybean Wheat Rice Corn Required yield gain per year on existing acreage Weighted average yield change per year Mean yield change per year ( ) 2050 production requirement 2050 projected production Source: University of Minnesota, PLOS ONE, Syngenta analysis x Four crops produce nearly two thirds of global calories Historical rates of yield growth would mean significant shortfalls Support for crop prices Need for more technology 22
23 On track for 2020 target Sales* $bn $25bn Specialty Sales growth at 8 percent CAGR Rice Global offers tailored to local needs DFC $13.4bn Cereals Corn New business models and collaborations Sugar cane Expanding the available market Soybean Vegetables Continued margin expansion * Excluding Lawn and Garden Source: Syngenta estimates 23
24 Discussion
25 Syngenta in Switzerland: Investing in the future Christoph Maeder, Head Legal and Taxes
26 Syngenta's activities in Switzerland Syngenta is a global company based in Switzerland Switzerland Is home to important decision makers, opinion leaders and international organizations Plays a major role in finding solutions to key global challenges Switzerland and Syngenta have a key role to play in raising public awareness for the global challenges related to agriculture and farmers This is why Syngenta will continue investing in Switzerland 26


27 Syngenta s activities in Switzerland Produktion Research and Development Global Headquarters Formulation and process development Sales and Marketing Field trials Production 27

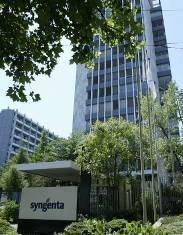
28 Syngenta in Switzerland 2013 Employees and Sites Basel: 1,660 Stein: 300 Kaisten: 40 Münchwilen: 250 Dielsdorf: 50 Monthey: 880 Total: 3,180 Apprentices 2013: 100 Vocational training for seven professions across Switzerland 28


29 Re-development of Global Headquarters: Project ROSE CHF 200 m investment Modern, attractive working environment for employees on Rosental site Construction started in 2012 Renovation of office buildings Creation of multi-space working areas Integrated conference and meeting area New restaurant facilities Large outdoor green space Reflects corporate identity of Syngenta To be completed by Classification: PUBLIC

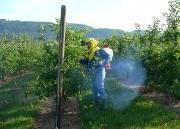
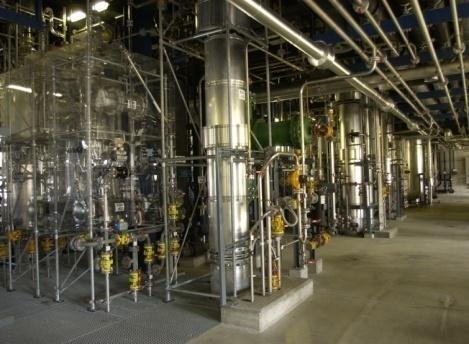
30 Monthey: Strategic Global Production Site 880 employees Production of herbicides, fungicides and insecticides for the world s most important crops Supplies all markets worldwide Since 2008, cumulative investments of CHF 210 m were made to increase capacity Further capacity expansions of up to CHF 240 m planned through 2017 Significant capacity expansion of SDHI fungicide production in

31 Stein: Globally Important Research and Development Site 300 employees Worldwide hub for chemical and biological Research and Development Recent investments include: - Broomrape control lab - Abiotic stress lab - Site infrastructure Further investments of ~ CHF 60 m planned 31

32 Münchwilen: Integrated Chemistry Development Center 250 employees Integrated development center for chemical crop protection processes and products Site focused on formulation, chemical analysis, pilot operations : Investments in laboratory and production facilities totalling ~ CHF 40 m 32


33 Kaisten and Dielsdorf: Production and Sales Hubs Kaisten: 40 employees Fully automated fungicide production facility Significant production capacity expansion nearing completion Total investments of CHF 55 m already realized Dielsdorf: 50 employees Focused on marketing and sales, development and logistics Home to Maag brand Infrastructure and field trial equipment investments 33 Classification: PUBLIC
34 Total investments in Switzerland Basel CHF 200 m Renovation of headquarters Stein CHF 60 m New R&D facilities Monthey CHF 450 m Capacity expansions Kaisten CHF 55 m Capacity expansions Münchwilen CHF 40 m Laboratories/production facilities Total > CHF 800 m 34
35 Key Priorities for Switzerland Maintain and improve business conditions and legal framework for businesses headquartered in Switzerland Multi-stakeholder dialogue is essential to develop a mutual understanding of respective goals and concerns Key aspects of economic policy in Switzerland are at center of political debate and can affect currently favorable economic conditions Switzerland has excellent potential to remain an attractive location for domestic and international companies Productive collaboration between policy makers and businesses to maintain favorable political conditions key to sustaining further investment 35

36 36