Combating Acid Soils. Brian Hughes and David Woodard Soils Consultants PIRSA. Feb 2018
|
|
|
- Theresa Reynolds
- 5 years ago
- Views:
Transcription


1 Combating Acid Soils Brian Hughes and David Woodard Soils Consultants PIRSA Feb 2018
2 Contents Understanding soil acidity basics Local data and trends Recent acidity work Soil ph mapping including SA lime comparison trials and precision ph mapping Lime sources MLR Tool and models
3 What are the Critical phca levels? < phca 5.5- acidity getting in the zone < phca 5.2 very sensitive crops begin to be affected, sensitive microbes and rhizobium effected < phca 5.0- acidity starts to creep into subsurface layers and Mn released in some soils < phca 4.8 significant Al release in most soils, most legumes nodulation affected < phca 4.5 tolerant crops affected < phca 4.0- irreversible degradation of clay and release of Fe Rural Solutions SA

4 Causes of acidification
5 SOIL ACIDITY IMPACTS- Soil ph and nutrient availability Increasing acidity Optimum ph Increasing alkalinity TOO MUCH: aluminium manganese Iron NOT ENOUGH: magnesium calcium potassium phosphorous molybdenum TOO MUCH: sodium Boron NOT ENOUGH: iron zinc manganese copper phosphorous

6 Acid Prone areas BIGG Angaston Williamstown
7 Rates of Acidification - mostly from 70s to 90s from Merry, CSIRO Land Use Mean Annual Acidification Rate Kg lime/ha/yr Low Intensity Grazing 30 Medium Intensity Grazing- some hay 100 cuts High Intensity Grazing, regular hay, 150 silage Cropping Pasture Rotation 100 Intensive Cropping- some pasture, 200 high N inputs Mostly continuous Cropping- high N 250 inputs Continuous cropping- high N, high 350?? rainfall, leaching years High N grassy pasture systems??
8 Examples in the MLR No lime, still acidifying
9 Examples in the MLR One application of 2.5 t/ha Soil ph (cacl) Soil Profile Depth
10 SOIL ph data- BIGG area phca Data Source no. < >5.5 BIGG dairy 74 12% 28% 26% 33% BIGG improved pasture 6 66% 17% 17% BIGG native pasture % 20% 65% < >5.4 S Ellis MLR 2013 # % 44% 14% 20% acknowledge data from G Keynes, B Hancock #Northern break up slightly better ph although includes some BV sites Lacking information on subsoil or subsurface acidity

11 SOIL ACIDITY AND MANAGEMENT SUMMARY OF RESPONSES IN CROPPING/LIVESTOCK TO LIME Large responses in cropping - up to 40% in some trials Particularly in sensitive species such as canola, barley and intolerant varieties of wheat Good responses in livestock - up to 30% increases in livestock weight
 Responses mostly using clover/ ryegrass pastures")
12 Mt Lofty Ranges Birdwood Historic Site Sites Soil phca Al Ca Cl2 Birdwood FSL/ brown clay Visual responses were still evident in 2001 on high lime plots (15 years after) Responses mostly using clover/ ryegrass pastures which are considered tolerant of acid soils.
 Camerons cropping Barstch low input pasture Agricola Angaston Southern Lime Dolomite Goolwa Hartley Quarry Calciprill- incorporated")
13 Current Activities- partners include GRDC, DEWNR, AMLR and MDB NRMBs, PIRSA Trials looking at new products, subsoil issues Tungkillo Trials ( ) Camerons cropping Barstch low input pasture Agricola Angaston Southern Lime Dolomite Goolwa Hartley Quarry Calciprill- incorporated Liquid Lime
14 Tungkillo Landcare Group cropping trial- 2 years after lime applied, no till Barley Yield - Diff from Control Mean - Cameron t/ha Difference from Control The results showed a significant effect of treatment (P= 0.034) on yield. Minimum non-zero LSD was 0.2 t/ha
15 Tungkillo ph by depth effect ph (CaCl) by depth, Cameron, 2016 Depth mm ph Agricola Angaston Calciprill Calciprill F Control Control F G Q Lime Liquid Lime S L Dolomite 160
16 Tungkillo Landcare Group cropping trial- 4 years after lime applied- better quality limes and higher rates best response

17 Tungkillo Landcare Group lime comparison pasture trial - low intensity grazing paddock- t/ha surface applied - Result around 5 ton increase/4 year
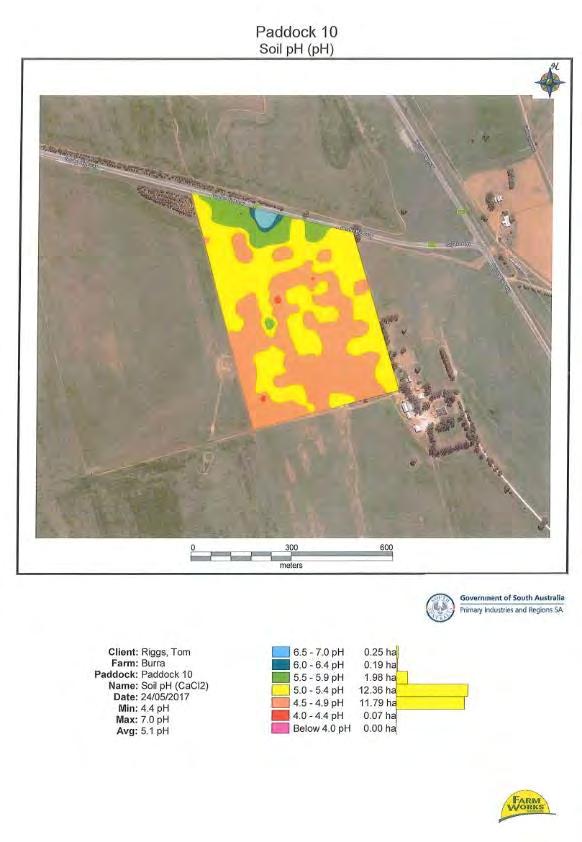


18 Evaluating Precision ph mapping
 does not work with all SA limes Other lime quality measures - surface area - RH value Calcium and Magnesium")
19 Understanding Lime Quality Neutralising value NV measures purity- CaCO3 equivalent Effective Neutralising value ENV- measures fineness (<300micron, , > 850) does not work with all SA limes Other lime quality measures - surface area - RH value Calcium and Magnesium content
20 MLR Lime Sources from Tungkillo trial + Source NV % ENV % Ca % Mg % Comment AB Angaston coarse Coarse product AB Angaston Penlime New finer product AB SL Dolomite Fine to handle GQ Hartley Coarser to handle Cawtes High surface area Agricola Robe dry, 82 wet 26 5 Dispersive lime not suited to ENV, high surface area Clare Q (Spalding) Low NV but v fine Kruse/Nutrilime Not suited ENV, contains other forms inc CaOH Calciprill Granular form not suited to ENV
21 How much Lime is Required: Simple Equation Accurate soil ph test required Soil texture factor Lime (t/ha) required to raise ph by one unit: ( assumes 100% NV) sand 2 ( ) sandy loam 3 ( ) loam 4 ( ) clay 5 ( ) Lime application rate =(Target ph - Current ph) x Texture factor Example for a Sandy loam soil: (ph 5.5 ph 4.5) x 3 t/ha = 3 t/ha of lime required.
 Computer software programs are available to help calculate: Lime application rates for acidic soils & cost comparisons of different lime products Soil acidification rates of cropping systems and")
22 website: under decision support tools l Treating soil acidity decision support tools (Acid Maths Made Easy! ) Computer software programs are available to help calculate: Lime application rates for acidic soils & cost comparisons of different lime products Soil acidification rates of cropping systems and lime required to counteract it Cost of production losses to the farm business from soil acidity All three tools are Excel Spreadsheets, enabling input of own soil type, ph, and paddock data. They are free and downloadable from:

23 Acidity Tools Lime Comparison
24 Take Home Messages Soil acidity still developing with higher rates in more intensive farming Most of the BIGG area is acid prone Soil testing data indicates a significant number of soil tests below 5.0, more information is required on subsurface ph Recent trials have confirmed lime responses in cropping and low input pasture with better quality limes still in front after 4 years Precision ph mapping is well suited to cropping soils but has some issues on long term pasture Various excel spreadsheets tools are available to compare the cost of limes or audit farming systems for acidity


25 Thank You to Project Sponsors/ partners Acknowledge A Harding, M Young, B Masters PIRSA