The development of Life Cycle Assessment for the Evaluation of Rainbow Trout Farming in France
|
|
|
- Jacob May
- 5 years ago
- Views:
Transcription

1 The development of Life Cycle Assessment for the Evaluation of Rainbow Trout Farming in France Elias Papatryphon, Jean Petit and Hayo, M. G. Van der Werf UMR Sol Agronomie Spatialisation, Institut National de la Recherche Agronomique, Rennes cedex, France
2

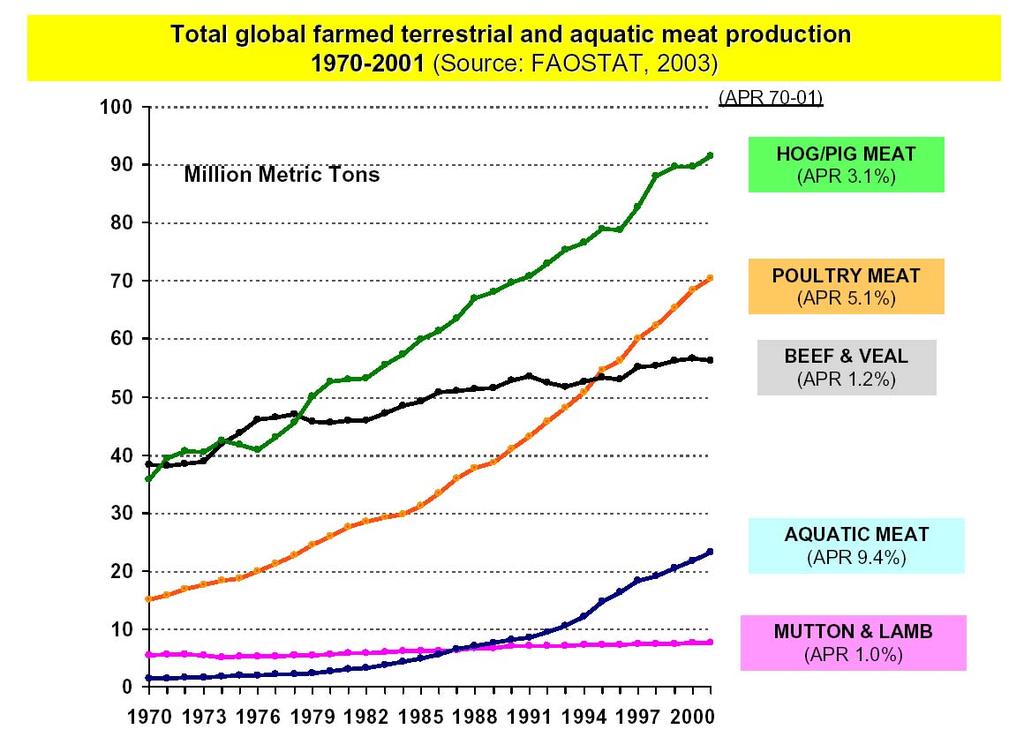
3 Aquaculture production is increasing at a fast pace but so do the environmental concerns associated with it Contribution of aquaculture to total world fisheries landings
4 Aquaculture production in France by major species for the year 2001 Total production tonnes Other tonnes Rainbow trout Roach 2508 tonnes 2500 European sea bass 2721 tonnes Common carp European sea bass 2721 European seabass Common carp 5649 Common carp 5649 tonnes Roach Rainbow trout tonnes (67%) Chart 1: 2001; France Other FAO, 2001
5 There are two major trout producing regions: Aquitaine and Bretagne Decrease in farms: environmental and economic constraints
6 Goal and Scope To develop and apply the LCA methodology for the evaluation of the environmental impacts of trout farming in France To assess the potential of using LCA as a tool for the identification and demonstration of the potential variability in the environmental impacts due to different choices in farm management
7 LCA of trout production in France Inputs Farm Fertilisers, Pesticides,... Agriculture Ships... Fishery Feed ingredients Feeds Oxygen Chemical treatments Veterinary treatments Infrastructure Equipment Production of eggs, fingerlings, market size fish Transformation, distribution, consumption Functional unit: 1 ton of trout live weight Raw material Energy resources Transport Disposal
8 Choice of farms objectives Commercial farms - intensive freshwater raceway type system Main producing regions (cover >50%) Variation in production capacity (cover >80%) Variation in market sizes (cover 100%) Variation on technological sophistication (types of equipment use) Construction of production scenarios Availability of and willingness to share data


9 Production scenario construction Production process A Production process B Production process C Broodstock/Eggs Juveniles/Portion Large/Very large Scenario I Scenario II
10 Description of farms used for the inventory analysis stage arm No Region Starting size Product type Production capacity Average weight at market size 1 Aquitaine broodstock/eggs 45 million eggs NA NA 2 Aquitaine eggs juveniles-portion 393 tonnes Bretagne eggs juveniles-portion 38 tonnes Bretagne juveniles portion-very large 231 tonnes Aquitaine juveniles portion-very large 100 tonnes Aquitaine juveniles portion-very large 230 tonnes Aquitaine juveniles portion-very large 330 tonnes Aquitaine juveniles portion-very large 192 tonnes TS
11 Impact categories and emissions Impact Categories Energy use NPP use Resources and Emissions Coal, oil, gas, uranium, lignite Biotic resources (direct use) Climate Change Potential CO 2, N 2 O, CH 4 Acidification Potential NH 3, NO 2, NO x, SO 2 Eutrophication Potential N, NH 3, NO 3, NO 2, NO x, P, PO 4, COD, ThOD
12 Hypotheses Trout Farm Inputs-Outputs: producers records Eutrophying emissions, energy use and emissions related to nonrenewable energy use Production of feed: extended assessment (Papatryphon et al., in press) All emissions, energy and biotic resource use during agricultural/fishery phase O 2 production and transport: industry-expert data (Air Liquide) Energy use and emissions related to non-renewable energy use Equipment production and transport: industry-expert data (Faivre) Energy use and emissions related to non-renewable energy use Farm infrastructure: farm measurements and data Energy use and emissions related to non-renewable energy use
13 Hypotheses All other processes: only energy use and emissions related to nonrenewable energy use is taken into account Allocation: economic for feed production, mass for oxygen production, none for fish production, none for manure production. Manure management: accounting of airborne emissions during agricultural application, no penalty for soil/water emissions as it is assumed to replace chemical fertiliser use.
14 Results
15 Production Scenarios: total calculated impacts between 2 trout production scenarios for the production of 1 ton of rainbow trout live weight Eutrophication Global Warming Acidification Boîtes à Moustaches (LCA.STA 63v*10c) Boîtes à Moustaches (LCA.STA 63v*10c) Boîtes à Moustaches (LCA.STA 63v*10c) I II I II 15.5 I II EP GWP AP EP EP PRODSCEN: scen1 PRODSCEN: scen2 Energy Use Boîtes à Moustaches (LCA.STA 63v*10c) I II Max Min Moy.+Err.Type 1500 Moy.-Err.Type GWP GWP Moy. PRODSCEN: scen1 PRODSCEN: scen NPP Use Boîtes à Moustaches (LCA.STA 63v*10c) I II 11.5 Max Min 10.5 Moy.+Err.Type Moy.-Err.Type AP PRODSCEN: scen1 Moy. AP PRODSCEN: scen2 Max Min Moy.+Err.Type Moy.-Err.Type Moy ENERGY NPP ENERGY PRODSCEN: scen1 ENERGY PRODSCEN: scen Max Min Max Min Moy.+Err.Type Moy.-Err.Type Moy.+Err.Type Moy.-Err.Type NPP Life Cycle Assessment in the NPP Moy. PRODSCEN: scen1 PRODSCEN: Agri-food scen2 Sector Moy.
16 Production Scenarios: process contribution analysis min average max min average max eggs portion 0 eggs portion large Scenario I: Portion trout Scenario II: Larger sizes
17 Farm variability: Total calculated impacts among 7 trout farms for the production of 1 ton of rainbow trout live weight Eutrophication Boîtes à Moustaches (LCA.STA 63v*10c) range: Global Warming Boîtes à Moustaches (LCA.STA 63v*10c) Acidification Boîtes à Moustaches (LCA.STA 63v*10c) range: range: EUTR GW ACID EUTR VAR8: T Energy Use Boîtes à Moustaches (LCA.STA 63v*10c) 1700 Max Min Moy.+Err.Type 1500 Moy.-Err.Type Moy. GW VAR8: T NPP Use Boîtes à Moustaches (LCA.STA 63v*10c) range: range: Max Min Moy.+Err.Type 10.0 Moy.-Err.Type Moy. ACID VAR8: T Max Min Moy.+Err.Ty Moy.-Err.Ty Moy ENERGY NPP ENERGY VAR8: T Max Min NPP Moy.+Err.Type Moy.-Err.Type Moy. Max Min Moy.+Err.Type Moy.-Err.Type Moy.
18 Farm variability: process contribution analysis 100% 80% 60% 40% 20% Diesel-farm Electricity-farm Oxygen-farm Equipment Infrastructure Feed Trout production 0% min EP Min Av Max Min Av Max Min Av Max Min Av Max Min Av Max av max min GW P av EP GWP AP Energy NPP max min AP av max min ENERGY av max min NPP av max
19 Farm variability: Eutrophication and NPP use 80 FCR vs. EUTR EUTR = * FCR Eutrophication Corrélation: r = FCR vs. NPP NPP = * FCR NPP Use Corrélation: r = EUTR 62 NPP FCR Feed:Gain Régression IC à 95% FCR Feed:Gain R= 0.85; R 2 = 0.73; p<0.01 R= 0.99; R 2 = 0.99; p<0.00 Régression IC à 95% Regression equations Predictions
20 Farm variability: Energy use Energy Use Données : LCA.STA 40v * 10c plus Feed:Water use Feed:Gain Rm= 0.82; R 2 = 0.67; p<0.11
21 Farm variability: Global warming and Acidification Global Warming Données : LCA.STA 40v * 10c Acidification Données : LCA.STA 40v * 10c plus Feed:Water use Feed:Gain plus Feed:Water use Feed:Gain Rm= 0.93; R 2 = 0.87; p<0.02 R= 0.92; R 2 = 0.86; p<0.02
22 Conclusions The present assessment is an estimate representing the range of potential impacts of trout farming in France The last stage in the production chain of trout farming is by far the most important in terms of environmental concern In general terms, the potential environmental impacts of trout production increase with final product size Feed is the largest single contributor to all environmental impacts associated with trout production The metrics feed : gain and feed : fresh water use explain the majority of variation regarding the environmental impacts of trout production (as considered in this assessment)
23 Conclusions Improvements in environmental impacts could be brought about by: On farm improvements in feed : gain ratio - All impacts shifting to smaller sized product improving feed composition and management genetic selection for better feed efficiency feed:water use - Energy use, Global warming, Acidification assuring adequacy of fresh water flow using most environmentally-friendly technology for water treatment (aeration, oxygenation, recycling) reducing production capacity under current feed:gain waste treatment technology - Eutrophication Improvements in agriculture/fishery stages of ingredient production Energy use, NPP use, Global warming, Acidification
24 Perspectives The methodology is now in place: inclusion of more farms, simulations for alternative systems, seek means of improvement, seek better metrics The results from a detailed LCA assessment may be used for the identification of metrics which could serve as simple indicators for the evaluation of farming systems