Ruminant grassland production systems in Ireland. Dr Michael O Donovan, Animal and Grassland Innovation Centre, Teagasc, Moorepark, Fermoy, Co Cork
|
|
|
- Leon Francis
- 5 years ago
- Views:
Transcription
1 Ruminant grassland production systems in Ireland Dr Michael O Donovan, Animal and Grassland Innovation Centre, Teagasc, Moorepark, Fermoy, Co Cork 1


2 Presentation outline Importance to economy Land and animal stats and locations Dairy, beef and sheep enterprises Enterprise road maps Grassland production Potential and challenges 2
3 3 Teagasc Presentation Footer

4 Irish Grazing System Characteristics Irish grasslands characterised by high pasture productivity potential, low variability in seasonal supply and quality Home produced feed and sustainable Volatile product prices and rising costs Increased grazed grass proportion decreases unit cost of production reducing feed, labour and capital investment costs Cost of alternative feeds: c/kg DM Relative Grazed grass Grass silage Concentrates Forage crops
5 Area farmed ( 000 Hectares) by type of land use and year ( ) Area farmed (AAU) 4,478 4,429 4,470 Crops and pasture 4,004 3,926 3,940 Pasture 2,337 2,299 2,177 Hay Grass silage 1,071 1, Maize silage Fodder rape and kale Beet Rough grazing in use
6 Number of livestock ( 000 Head) by type of animal and year ( ) Total cattle 6,903 6,964 7,364 Cows 2,314 2,372 2,514 Dairy cows 1,163 1,296 1,433 Suckler cows 1,150 1,076 1,081 Bulls Cattle: 2 years and over Cattle: 1-2 years 1,811 1,705 1,914 Cattle: under 1 year 1,969 2,042 2,131 Total sheep 5,007 5,139 5,253 Breeding sheep 2,649 2,564 2,592 6


7 Distribution of dairy and suckler cows in Ireland Dairy Cows Suckler Cows 7

8 8 Distribution of sheep in Ireland


9 Important assumption The vast majority of milk and meat produced in Ireland for the future will be from pasture-based systems Reasons: Pasture-based system has both a comparative and competitive advantage (Dillon et al. 2005) Pasture-based systems have greater sustainability: Economic- family farming business Social- both internal and external Ecological- climate, water, soil, fauna & flora Dairy products from pasture-based systems are of superior nutritional value (O Callaghan et al. 2017) 9
10 Grazing systems versus indoor based systems Grazing Systems Indoor Systems Grazing Utilisation Conservation based (harvesting/zero grazing) >200 days at grass days at grass Medium milk production per cow High milk production per cow Low fixed and variable cost High fixed and variable cost Minimum to low building investment High level of buildings investment Machinery minimum/high contractor usage Labour flexibility/mindset open Seasonal workload Resilient systems consistent margins Machinery high requirement/little contractor usage Labour routine/mindset closed All Year round workload High risk system exposed to milk price variations 10
11 /ha Grass basics - farm efficiency Year, region and soil group significant factors across all dependent variables Pasture Utilised (kg DM/ha) - Net Profit ( /ha) 3500 Net profit ( /ha) Production costs ( /kg MS) 3000 Estimate (S.E) P - value Estimate (S.E) P - value R 2 = Pasture utilization (t DM/ha) 173 (6.0) < (0.008) < Grazing 2000 season length (days) 1.85 (0.45) < NS 10% increase 1500 in the proportion of (13.7) < (0.016) < purchased feed 1000 Milk protein (%) 191 (97) < (0.1) < Milk solids yield (kg/cow) 3.26 (0.18) < (0.0002) < Non-significant factors Herd size, farmer age, fat (%) kg DM/ha 11
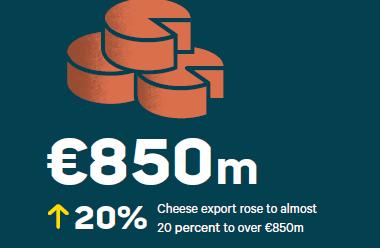
12 Irish dairy production 7.25 billion litres approx. (2017) 18,351 dairy farmers, averaging c 400,000 litres Average constituents. 4.09% fat, 3.51% protein 91% of milk produced in spring calving herds 85% of total production is exported 10 milk processors (Co-op and Co-op/plc) 16 milk purchasing Co-operatives 12
 and in 2016 1,397,884 accounted for 21% of total agri-food exports Average")
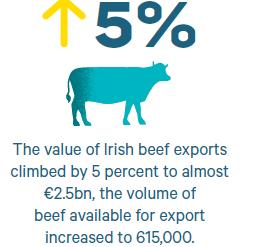
13 Changes Beef Production in structure in of Ireland Irish dairying KPI Number Ireland of has farmers approx. 94,000 beef farmers 18,460 which accounts 18,351 for Peak 39% cow of Gross numbers Agricultural Output 1,070,860 (2015) and in ,397,884 accounted for 21% of total agri-food exports Average 970,000 herd suckler size cows with an average 58 cows herd size of 75 less cows than Cows 20 cows in herds > ,060 (28%) 659,149 (47%) Farmers 26,100 milking single suckling >100 cows herds with 2,080 greater (11%) than suckler 4,26210 (23%) CSO cows Data 2010 and 2016 Systems include (a) suckling, (b) store to store, (c) store to Estimated beef and (d) Extra calf Labour to beef Requirements:. 2,500 employees to facilitate increased cow numbers 1,700 successors for regeneration of retiring farmers 13


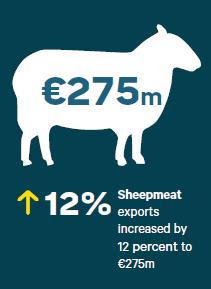
14 Lowland and Hill Lamb Production in Ireland Output: 1.4 lambs /ewe Lambing: Feb-March Ewe Breeds: Suffolk, Texel, Belclare & Hill breed Crosses Terminal Breeds: Suffolk, Texel Charollais Target Carcass Wt: Kg Buoyant Prices Significant scope to improve output / ewe & hectare Output: 0.8 lambs /ewe Lambing: Late March-April Ewe Breeds: Scottish Blackface & Cheviot Crossing: Scottish Blackface & Cheviot, Texel, Blue Leicester Target Carcass Wt: Kg; 16-19Kg Buoyant Prices Significant scope to improve output /ewe Genetic improvement (Sheep Ireland) Crossbreeding to produce prolific replacements for lowland flocks 14 Teagasc Presentation Footer
15 Dairy sector roadmaps for current performance, future performance targets up to 2025 and research targets Current 2025 target Research target Milk delivered (kg/cow) 5,036 5, Milk solids (fat + protein) delivered (kg/cow) Calving interval (days) Stocking rate (LU/ha) Herbage utilised (t DM/ha) Concentrate per cow (kg) 1, Nitrogen use efficiency (%) Greenhouse gas emissions (kg CO 2 e/kg MS)
16 Beef sector roadmaps for current performance, future performance targets up to 2025 and research targets Suckler Beef Sector Current 2025 target Research target Calving interval (days) Calves/cow/year Herbage utilised (t DM/ha) Greenhouse gas emissions (kg CO 2 e/kg carcass) Concentrate per LU (kg) Grass (% of total diet) Nitrogen fertiliser (kg N/ha)
17 Sheep sector roadmaps for current performance, future performance targets up to 2025 and research targets Sheep Sector Current 2025 target Research target Lambs weaned/ewe Stocking rate (ewe/ha) Concentrate input (kg/ewe) Lambs drafted by Oct 1 (%) Nitrogen fertiliser (kg N/ha)


18 PastureBase Ireland kg DM/day 100 National Grass Growth Curve 2016, 2017 and Dec 01-Nov 01-Oct 01-Sep 01-Aug 01-Jul 01-Jun 01-May 01-Apr 01-Mar 01-Feb >6000 dairy farmers on the system, nearly 1400 farm covers completed weekly in 2018 Computers and Electronics in Agriculture (Hanrahan et al, 2017)
19 Grassland DM production in Ireland NFS Bottom 20% PBI Average PBI Farm Top 20% PBI 19
20 Grassland offers sustainability in Financial -Profitability -Costs per kg MS or live weight the broader context Internal Social -Working conditions -Hours worked per week -Intergeneration succession -Skill set of work force Sustainable Production System Environment -N and P losses -Biodiversity External Social -Animal welfare -High herd health status -Milk quality -Animal grazing days
21 Grassland improvements Sustainable intensification from grassland need to make farms MORE self sufficient from grass Grassland utilisation is a key predictor of PROFIT (need to move grass utilisation on farms) Grass requires focussed management need prediction models for GROWTH Grassland INFRASTRUCTURE needs to be modernised Soil NUTRIENT management, nitrogen, phosphorus and potassium Continual requirement for ANIMALS suited to grazing systems (production, fertility, calving interval) 21
22 Grassland improvements Grass breeding ON FARM performance Clover has untapped potential Grassland needs to embrace SMART TECHNOLOGY for management, use of big data and applications to management Research and knowledge transfer need to be FARMER agenda driven (are we really focussing on grass) In Ireland we have huge possibilities to utilise grass better 22