Fertilizer Subsidies in Sub- Saharan Africa: Smart Policy or Political Trap?
|
|
|
- Suzanna Tucker
- 5 years ago
- Views:
Transcription

1 Participate during the seminar: #AgEvents March Follow 25, us on 2015 Twitter twitter.com/agrilinks Like us on Facebook facebook.com/agrilinks Fertilizer Subsidies in Sub- Saharan Africa: Smart Policy or Political Trap? Speakers Michael Carter, University of California at Davis Thomas Jayne, Michigan State University Facilitator Julie MacCartee, USAID Bureau for Food Security
.")
2 Michael Carter Michael Carter University of California at Davis Michael R. Carter is Professor of agricultural and resource economics at the University of California, Davis. Carter directs the BASIS Assets, Market Access Innovation Lab, and the I4 (Index Insurance Innovation Initiative). His current research examines poverty dynamics and productive social safety nets, and the evaluation of interventions that aim to boost small farm uptake of improved technologies. His findings feature a suite of projects that design, pilot and evaluate index insurance contracts.
.")
3 Thomas Jayne Thomas Jayne Michigan State University Thomas Jayne s career has been devoted to promoting effective policy responses to poverty in Africa. Jayne is a university foundation professor of agricultural, food, and resource economics at Michigan State University (MSU). He is also visiting professor at the University of Pretoria and adjunct professor at the Indaba Agricultural Policy Research Institute in Lusaka, Zambia. Jayne has played a major role in building MSU s partnerships with African research institutes.

4 Michael Carter Title Slide
5

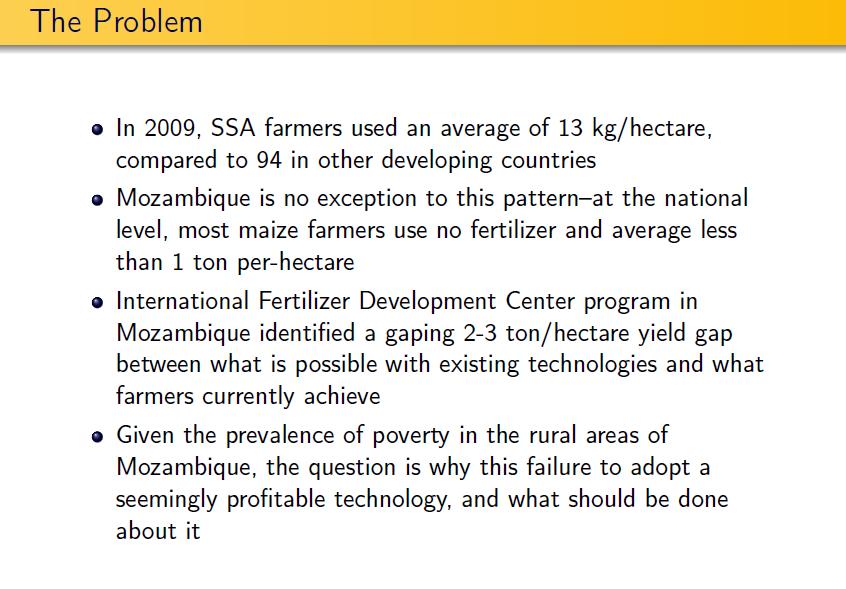
6 The Problem: Completing Explanations

7 Input Subsidies: temp/permanent
8 Mozambique Temp Voucher Program

9 Impact Evaluation Design
10 Impact Evaluation Design, Chart

11 Impact Evaluation Design, Timeline

12 Uptake & Use of Vouchers

13 Summary of Analytical Approach
14 Agronomic Impacts: Maize, Voucher Use
15 Agronomic Impacts: Maize, Graph 2
16 Agronomic Impact: All Ag Activities
17 Econ Impact: Living Standards
18 Econ Impact: Living Stand. Graph

19 Econ Impact: Living standard 2
20 Econ Impact: Assets

21 Returns to Fertilizers Learning Impacts

22 Returns to Fertilizer: Validity of Learning

23 Financial Interventions: Money Matters

24 Financial Interventions: Programs

25 Financial Interventions: Findings,
26 Summary: Smart Subsidies

27 Summary: making Smart subs smarter
28 Summary: making smart subs smarter. 2
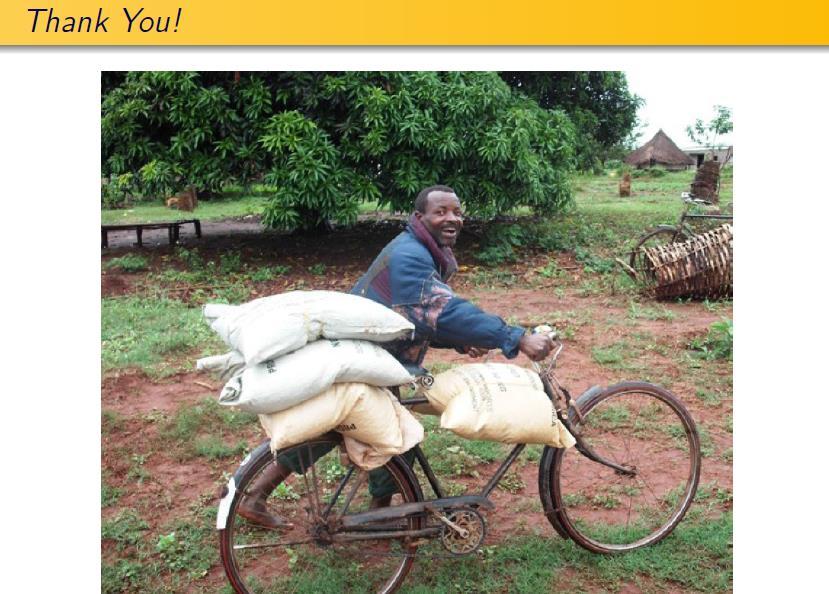
29 Thank you
30 Beyond Input Subsidy Programs: Toward a Holistic and Sustainable Agricultural Growth Strategy in Sub-Saharan Africa T.S. Jayne, Michigan State University USAID/Bureau for Food Security Washington, DC March 25,
31 Expenditures of Input Subsidy Programs Country Annual Program Cost (USD million) % of Ag Budget Malawi 152 to to 71% Tanzania 92 to to 46% Zambia 101 to to 40% Senegal 36 to to 31% Ghana 53 to to 31% Nigeria 108 to 190???? (officially 26%) Kenya 22 to 81 9 to 26% 31
32 Objectives: 1. How to move from a situation where ISPs are the cornerstone of agricultural development to a holistic program of sustainable productivity growth? 2. What would such a holistic program look like? 3. How to achieve it? 32
33 Five conclusions: 1. Population growth leading to land scarcity smaller farm sizes for most rural people 2. Fallows slowly being eliminated in areas of high population density 3. Continuous cultivation with limited nutrient recycling soil mining 33
34 Rural Population Density 34
35 Five conclusions: 1. Population growth leading to land scarcity smaller farm sizes for most rural people 2. Fallows slowly being eliminated in areas of high population density 3. Continuous cultivation with limited nutrient recycling leading to soil mining 4. Soil degradation 35

36 Soil and land degradation a huge concern Major conclusion of Montpellier Panel report Extent of already damaged land: 65% of arable land 30% of grazing land 20% of forests Burden disproportionately carried by smallholders 36
37 Five conclusions 1. Population growth leading to land scarcity smaller farm sizes for most rural people 2. Fallows slowly being eliminated in areas of high population density 3. Continuous cultivation with limited nutrient recycling soil mining 4. Soil degradation 5. Evidence of low and declining crop response rates to inorganic fertilizer application 37
38 Review of maize-fertilizer response rates on farmer-managed fields Study country Agronomic response rate (kgs maize per kg N) Morris et al (2007) W/E/S Africa Sheahan et al (2013) Kenya Marenya and Barrett (2009) Kenya 17.6 Liverpool-Tasie (2015) Nigeria 8.0 Burke (2012) Zambia 9.6 Snapp et al (2013) Malawi 7.1 to 11.0 Holden and Lunduka (2011) Malawi 11.3 Pan and Christiaensen (2012) Tanzania 8.5 to Minten et al (2013) Ethiopia 11.7
39 Highly variable crop response rates even among farmers in same areas in same seasons 39
40 Variation in farmers efficiency of fertilizer use on maize, Agroecological Zone IIa, Zambia 5 4 Percent of farms Marginal product (kgs / kg nitrogen) Note: Zone IIa is a relatively high-potential zone suitable for intensive maize production; mean national NUE = 9.6 kgs maize per kg nitrogen (Burke, 2012).
41 African farming systems in densely settled areas commonly display 4 forms of unsustainable land intensification 1. Soil mining 2. Inadequate recycling of organic matter loss of SOC 3. Demise of fallows 4. Limited profitability of using fertilizer at full market prices 41
42 Factors depressing NUE of inorganic fertilizer use: 1. Low soil organic matter significant decline in SOM over past 20 years in Malawi (Mpeketula and Snapp) 42
43 Fertilizer response rates in degraded areas Maize yields as a function of plot soil carbon content Kg/ha Plot carbon content (%) 43 Source: Marenya & Barrett 2009
44 Fertilizer response rates in degraded areas Estimated marginal value product of nitrogen fertilizer conditional on plot soil carbon content Ksh/kg N Plot carbon content (%) 44 Source: Marenya & Barrett 2009
45 Factors depressing NUE of inorganic fertilizer use: 1. Low soil organic matter significant decline in SOM over past 20 years in Malawi (Mpeketula and Snapp) 2. Acidification 45

46 From Larson and Oldham, Mississippi State University Extension Service, Farm Larson and Oldham Source: Burke,

47 Lusaka Province Photo courtesy of Dingi Banda, Lusaka Province, Zambia 47
48 Factors depressing NUE of inorganic fertilizer use: 1. Low soil organic matter significant decline in SOM over past 20 years in Malawi (Mpeketula and Snapp) 2. Acidification 3. Micro-nutrient deficiencies 48
49 Everyone agrees that inorganic fertilizer use must go up why isn t it happening? dkdkdk Low crop response rates m to N Population growth Deficiencies in SOC and micronutrients / acidification Land pressures / incentives to intensify Reduced fallows / increased fertilizer use 49
50 Everyone agrees that inorganic fertilizer use must go up why isn t it happening? dkdkdk Low crop response rates m to N Population growth Depressed profitability of fertilizer use Deficiencies in SOC and micronutrients / acidification Land pressures / incentives to intensify Reduced fallows / increased fertilizer use 50
 profitable return Source: Burke,")
51 Average product of fertilizer (maize kg/kg) Cumulative distribution of average product of fertilizer used in Zambia (2004,2008) profitable return Source: Burke,
52 Factors affecting N use efficiency 1. Soil organic carbon 2. Acidification (ph) mainly affects basal 3. Micronutrients 4. Soil moisture N response on irrigated > rainfed fields 5. Timing of fertilizer application 6. Timely and sufficient weeding 7. Rotation of crops on a given plot 8. Contours / ridging to prevent erosion on sloped fields Fixation with N ISPs need to be part of a more holistic approach so that N can get sufficiently high crop response
53 Focus on making inputs profitable effective demand Profitable use (main drivers): output price input prices crop response rates
54 Elements of a holistic strategy: 1. R&D (national ag research systems) 2. Extension programs / soil testing 3. Programs to help farmers restore soil quality 4. Conservation agricultural practices 5. Physical infrastructure 6. Reducing costs in input supply chains 7. More appropriate fertilizer use recommendations 54

55 Oft-asked policy question: Given that ISPs will continue, what concrete guidance can be identified to improve their effectiveness? We identify 3 proposals: 1. Holistic approach that regards ISP as one component of an integrated sustainable intensification campaign 2. Target poor farmers to achieve more equitable development impacts 3. Redouble political will to reduce corruption 55
56 Proposal 1: Raise public investment in agronomic research and extension programs to enable farmers to use fertilizer more efficiently
57 Proposal 2: Reconsider targeting guidelines to achieve more equitable development impacts
58 FISP fertiliser received (2010/11 crop season) and expected maize sales, 2011, by farm size category 58 Total area cultivated (maize + all other crops) Number of farms % of farms % of farmers receiving FISP fertilizer kg of FISP fertilizer received per farm household % of farmers expecting to sell maize Expected maize sales (kg/farm household) ha 616, % ha 489, % ha 315, % ha 42, % ha 6, % Total 1,471, % (A) (B) (C) (D) (E) (F) Source: MACO/CSO Crop Forecast Survey, 2010/11
59 FISP fertiliser received (2010/11 crop season) and expected maize sales, 2011, by farm size category 59 Total area cultivated (maize + all other crops) Number of farms % of farms % of farmers receiving FISP fertilizer kg of FISP fertilizer received per farm household % of farmers expecting to sell maize Expected maize sales (kg/farm household) (A) (B) (C) (D) (E) (F) ha 616, % 14.3% ha 489, % 30.6% ha 315, % 45.1% ha 42, % 58.5% ha 6, % 52.6% Total 1,471, % 28.6% Source: MACO/CSO Crop Forecast Survey, 2010/11
60 FISP fertiliser received (2010/11 crop season) and expected maize sales, 2011, by farm size category 60 Total area cultivated (maize + all other crops) Number of farms % of farms % of farmers receiving FISP fertilizer kg of FISP fertilizer received per farm household % of farmers expecting to sell maize Expected maize sales (kg/farm household) (A) (B) (C) (D) (E) (F) ha 616, % 14.3% ha 489, % 30.6% ha 315, % 45.1% ha 42, % 58.5% ha 6, % 52.6% Total 1,471, % 28.6% 77.1 Source: MACO/CSO Crop Forecast Survey, 2010/11
61 FISP fertiliser received (2010/11 crop season) and expected maize sales, 2011, by farm size category 61 Total area cultivated (maize + all other crops) Number of farms % of farms % of farmers receiving FISP fertilizer kg of FISP fertilizer received per farm household % of farmers expecting to sell maize Expected maize sales (kg/farm household) (A) (B) (C) (D) (E) (F) ha 616, % 14.3% ha 489, % 30.6% ha 315, % 45.1% ha 42, % 58.5% ha 6, % 52.6% Total 1,471, % 28.6% 77.1 Source: MACO/CSO Crop Forecast Survey, 2010/11
62 Proposal 3: greater political will for ensuring that the subsidies go to the intended beneficiaries Currently 1/3 of state resources for ISPs are diverted (Malawi and Zambia), more in other cases (pre-2011 Nigeria)
63 Ranking of Alternative Investments: Meta-Study Evidence from Asia and Africa The Economist IFPRI study Policies Infrastructure investment Agricultural R&D Agricultural extension services Credit subsidies Fertilizer subsidies Irrigation
64 Ranking with respect to agricultural growth: Evidence from Asia The Economist IFPRI Policies 1 Infrastructure investment 3 1 Agricultural R&D 2 2 Agricultural extension services 5 Credit subsidies 7 3 Fertilizer subsidies 6 4 Irrigation 4 5
65 Ranking with respect to poverty reduction: Evidence from Asia The Economist IFPRI Policies 1 Infrastructure investment 2 1 Agricultural R&D 3 2 Agricultural extension services 4 3 Credit subsidies 7 4 Fertilizer subsidies 5 6 Irrigation 5 5
66 Conclusions 1. ISPs are a powerful tool to quickly raise food production. 2. But if they account for too large a share of agricultural spending, they can crowd out other public investments required for sustainable development 3. Spending a large share of the ag budget on ISPs may not be the most effective way to promote the welfare of it citizens, but it is a highly demonstrable way to do so. 66
67 Conclusions 4. ISPs would be more effective if adequate resources were allocated to complementary public investments 5. More balanced public expenditure patterns could more effectively promote national policy objectives 6. There are concrete steps for improving ISP effectiveness related to governance and political commitment More holistic approach to sustainable intensification 67


68 Thank you Thank you Indaba Agricultural Policy Research Institute 68
69 Survey data vs. researcher-managed trials Reasons why researcher-managed trials tend to show 2-3 times higher NUE than in farmer-managed survey data: 1. trials often non-randomly select farmers known to extension agents, often master farmer types 2. Trials often instruct farmers to follow strict protocols that most farmers cannot adhere to on their own plots 3. observer effect 4. Trials often entail throwing out observations in which the plot incurred damage due to insects, disease, monkeys, flooding, etc 69


70 Thank You Thank you for joining us! Share Feedback Take a moment to respond to our Polls. You can also visit the event page to post comments & questions. Stay In Touch Contact Us: agrilinks@agrilinks.org OR Julie MacCartee, USAID/BFS jmaccartee@usaid.gov Upcoming Events April 15 th : Agrilinks Twitter Chat April 23 rd : Joint Agrilinks + Microlinks Seminar Agrilinks and the AG Sector Council Seminar Series are products of the USAID Bureau for Food Security under the Feed the Future Knowledge-Driven Agricultural Development (KDAD) project.
71 Additional Info Additional Information
72 Regression Approach
73 Impacts on Fertilizer Use
74 IHST Direct Impacts on Fertilizer Use
75 Impacts on Ag Production, IHST Estimates
76 Impacts of Consumption
77 Learning from Others

78 Learning from Others 2

79 Learning from Others: Network on Fertilizer Use
80 IV Estimates of Returns to Fertilizer