Dr. Junning Cai (FAO)
|
|
|
- Norma Gregory
- 5 years ago
- Views:
Transcription
 International Institute of Fisheries Economics and Trade (IIFET) Conference 2016 Monday")
1 SPECIES DIVERSIFICATION IN AQUACULTURE A GLOBAL ASSESSMENT Dr. Junning Cai (FAO) International Institute of Fisheries Economics and Trade (IIFET) Conference 2016 Monday 11 - Friday 15 July 2016 Aberdeen, Scotland
2 Co-authors CAI, Junning: Food and Agriculture Organization (FAO) of the United Nations, Rome, Italy. YAN, Xue: Chinese Academy of Fishery Sciences, Beijing, China ZHOU, Xiaowei: Food and Agriculture Organization (FAO) of the United Nations, Rome, Italy.
3 Aquaculture species diversification: a popular notion attractive to policymakers and other experts This paper would: Examine/clarify the concept and measurement of species diversification in aquaculture For systematic assessment and monitoring species diversification in aquaculture Examine the status and trend of species diversity in aquaculture at the global, regional and national levels and highlight some salient patterns or stylized facts of species diversification in aquaculture Providing knowledge and information for evidence-based policymaking and business planning Explore how to use species diversity measures to facilitate evidencebased decision makings Serve as a background paper for the Aquaculture Production Module under the World Aquaculture Performance Indicators (WAPI).
4 Part I: Data and method
5 Data source: FAO data on aquaculture production (FishSTAT) The most comprehensive dataset on global aquaculture production Covering 206 countries or territories 580 species items Quantity data from ; value data from Different farming environments: freshwater, brackishwater, marine Imperfect data Data submitted by countries may not be accurate. Some FishSTAT species items are actually species groups. Some species-level data are estimated from more aggregated level. Value data are less reliable than quantity data.

6 Multiple dimensions of species diversification measurement 3 diversity indices: effective number of species (q =0, 1 or 2); also some supplement indices 2 production measures: quantity and value 328 species scopes: aquatic products, seafood, fish, finfish, crustacean, molluscs, tilapias, etc. Timeframe: ; focusing on Measuring aquaculture species diversification Types: Focusing on FishSTAT species items (580 in total); also considering higher groups 243 countries or country groups (e.g. regions, etc.) 23 areas (e.g. Northeast Pacific) 5 environments: freshwater, marine, brackish, marine+brackish, all)
7 Diversity indices
8 Effective number of species (true diversity) Basic indices DD qq = nn ii=11 ss ii qq 11/(11 qq) nn iiii tttttt nnnnnnnnnnnn oooo ssssssssssssss qq = 0: DD 0 = nn measuring the richness. qq = 1: DD 1 = exp nn ii=1 ss ii ln(ss ii ) equivalent to Shannon-Wiener- Weaver (entropy) index. nn ii=1 2 qq = 2: DD 2 = ss 1 ii equivalent to the inverse Simpson- Hirschman-Herfindahl index. Supplement/derivative indices Gamma diversity (γ)= aaaaaaaaa dddddddddddddddddd α bbbbbbbb dddddddddddddddddd ( ) DD 1 /DD 0 or DD 2 /DD 0 as a measure of evenness?

9 Some notes on diversity indices DD qq=0 DD qq=1 DD qq=2 It is not unusual that DD qq=0 and DD qq=1 (or DD qq=2 ) have opposite indication of species diversification. DD qq=1 and DD qq=2 usually have consistent indication of species diversification. DD qq=1 and DD qq=2 may have opposite indication of species diversification.


10 A case of D q=1 and D q=2 giving opposite indication of species diversification Farmed marine fish species in Korea: Which year is more diversified, 2011 or 2012?
11 Quantity vs. value measures
12 Generally speaking, species diversity measured in terms of value greater than that measured in terms of quantity q=1; Scope =Aquactic products; Environment=All; Area=All; year= Number of cases where D_value / D_quantity D_value/D_quantity region All cases >1 1 <1 Mean 95% confidence interval Min Max Africa 1, Asia 1, Europe LAC Northern America Oceania World 4,389 1, ,
13 Cases of large deviation between D_quantity and D_value Top-10 countries with the greatest D_value/D_quan Top-10 countries with the smallest D_value/D_quan region year countries D_value D_quan tity D_value/D_ quan region year countries D_value D_quantity D_value/D_ quan Asia 2006 Singapore Asia 2000 Thailand Europe 1998 Spain Africa 2010 South Africa Oceania 1992 Fiji, Republic of LAC 1997 Mexico Asia 1993 Malaysia LAC 2004 Uruguay Asia 2008 Timor-Leste Asia 2009 Sri Lanka Africa 2005 Tanzania, United Rep. of Africa 1990 Mauritius Asia 2013 Indonesia Africa 2005 Mozambique Asia 2013 Korea, Republic of Africa 1994 Tunisia LAC 2009 Jamaica Asia 2007 China, Hong Kong SAR Europe 1998 Netherlands Africa 2006 Madagascar Year: ; Area = All; Environment = All; Scope = Aquatic products; Diversity measure (q =1)

14 Singapore in 2006: a case of D-value >> D_quantity Diversity measured by quantity = 3.65 Diversity measured by value = 17.01

15 Thailand in 2000: a case of D_value << D_quantity Diversity measured by quantity = 7.48 Diversity measured by value = 2.08
16 Quantity and value-based diversity measures tend to give similar indication of changes in diversity Among 7131 cases of changes in species diversity from 1990 to 2014 for various countries, scopes, and environments, the two measures indicate opposite changes in diversity in 348 cases. For Scope = Aquatic products and Environment = All, the two measures indicate opposite changes in 19 out of totally 152 cases (see chart to the right).

17 Indonesia: a case of quantity and value-based diversity indices give opposite indication of species diversification

18 South Africa: a case of quantity and value-based diversity indices give opposite indication of species diversification
19 Geo-scale: country and region
20 Top-10 species in Europe: 1990 vs Diversity in 1990 = 9.8 Diversity in 2014 = 6.7
21 Regional species diversification may not reflect the average or sum of species diversification of countries in the region: the case of Europe


22 Regional species diversification may not reflect average species diversification of countries in the region: the case of Australia/New Zealand
23 Farming environments

24 Species diversification in all environments may not reflect the average or sum of species diversification in different environments
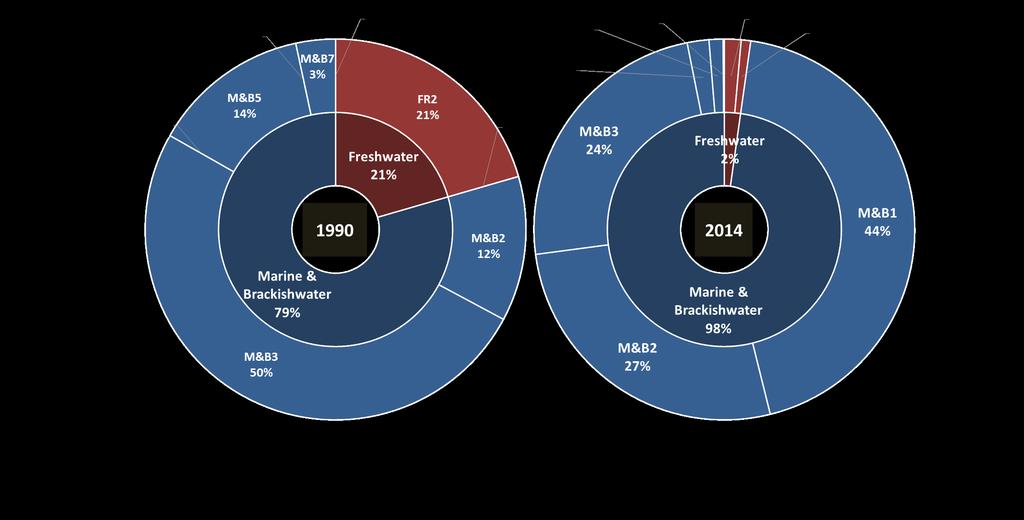
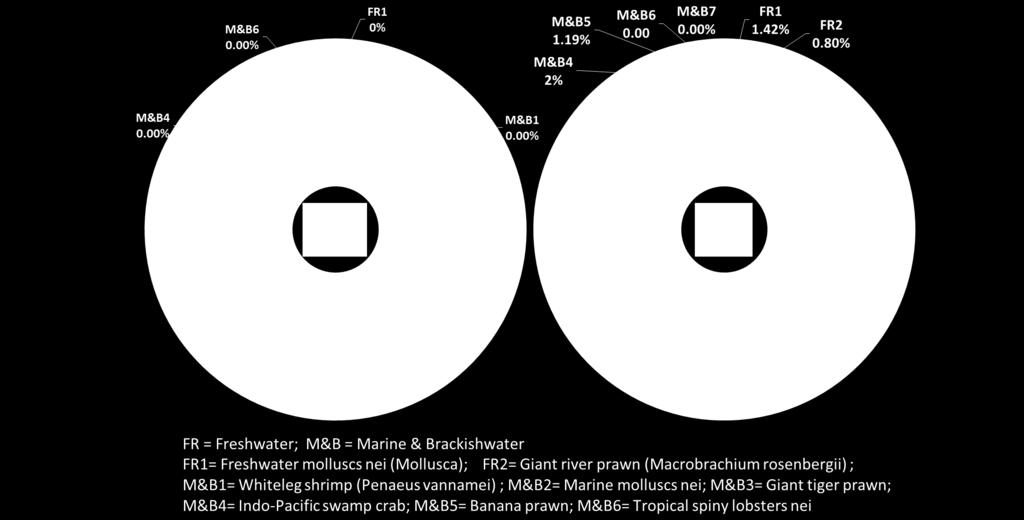
25 Species diversification in Viet Nam s shellfish aquaculture
26 Species scope


27 Examples of 328 species groups
28 Species diversity for major aquaculture species groups Year: ; Area = All; Environment = All; Scope = Aquatic products; Diversity measure (q =1)
29 Part II: Salient patterns or stylized facts of species diversification in aquaculture
30 1990 to 2014: More species diversified global aquaculture

31 More species diversified aquaculture for the world as a whole
32 More species diversified aquaculture for most of species scopes Changes in species diversity in global aquaculture from 1990 to 2014 World including China World without China Scope Share of world Share of world Number of countries production (%) Number of countries production (%) Diversity increase Diversity decrease Diversity increase Diversity decrease Diversity increase Diversity decrease Diversity increase Diversity decrease Aquatic products Seafood Fish Finfish Freshwater fishes Diadromous fishes Marine fishes Shellfish Crustaceans Molluscs Miscellaneous aquatic animals Miscellaneous aquatic animal products Aquatic plants Area = All; Environment = All; Production measure = Quantity; Diversity measure (q =1)


33 More species diversified aquaculture in most farming environments Country/region = World; Area = All; Environment = All; Production measure = Quantity; Diversity measure (q =1)
34 Aquaculture species diversification: regional perspective

35 Less species diversified aquaculture in developed regions

36 More species diversified aquaculture in developing regions

37 Less species diversified aquaculture in Africa
38 Top-10 species in Africa: 1990 vs Diversity in 1990 = 8.2 Diversity in 2014 = 7.2
39 Aquaculture species diversification in Africa
40 Asia: the most diversified region Year: ; Area = All; Environment = All; Scope = Aquatic products; Diversity measure (q =1)

41 More species diversified aquaculture in Asia
42 Top-10 species in Asia: 1990 vs Diversity in 1990 = 30.8 Diversity in 2014 = 41.3
43 Asian countries
44 More species diversified aquaculture in Europe

45 Top-10 species in Europe: 1990 vs Diversity in 1990 = 9.8 Diversity in 2014 = 6.7
46 European countries

47 More species diversified aquaculture in Latin America and Caribbean
48 Top-10 species in LAC: 1990 vs Diversity in 1990 = 9.1 Diversity in 2014 = 11.0
49 LAC countries

50 More species diversified aquaculture in Northern America

51 Top-10 species in Northern America: 1990 vs Diversity in 1990 = 6.6 Diversity in 2014 = 9.2
52 American countries

53 More species diversified aquaculture in Oceania

54 Top-10 species in Oceania: 1990 vs Diversity in 1990 = 5.6 Diversity in 2014 = 6.5

55 Oceanian countries
56 Species diversification for different species scopes
57 Species diversification in tilapia farming Year: ; Area = All; Environment = All; Scope = Aquatic products; Diversity measure (q =1)
58 Species diversification in catfish farming Year: ; Area = All; Environment = All; Scope = Aquatic products; Diversity measure (q =1)

59 Species diversification in salmonid farming Year: ; Area = All; Environment = All; Scope = Aquatic products; Diversity measure (q =1)
60 Species diversification in marine shrimps and prawns farming (I) Year: ; Area = All; Environment = All; Scope = Aquatic products; Diversity measure (q =1)
61 Species diversification in marine shrimps and prawns farming (II) Year: ; Area = All; Environment = All; Scope = Aquatic products; Diversity measure (q =1)
 Year:")

62 Species diversification in marine perch_like fishes farming (I) Year: ; Area = All; Environment = All; Scope = Aquatic products; Diversity measure (q =1)
 Year:")

63 Species diversification in marine perch-like fishes farming (II) Year: ; Area = All; Environment = All; Scope = Aquatic products; Diversity measure (q =1)
64 Salient patterns or stylized facts
65 Some evidence of positive correlation between farmed fish species diversification and production scale Year: ; Area = All; Environment = All; Scope = Fish; Production measure = Quantity; Diversity measure (q =1)
66 Aquaculture products: the larger the production; the greater the diversity Year: ; Area = All; Environment = All; Scope = Aquatic products; Diversity measure (q =1)

67 China: the largest and most diversified aquaculture producer
68 Declined species diversification in China s marine shrimps and prawn aquaculture Year: ; Area = All; Environment = All; Scope = Aquatic products; Diversity measure (q =1)
69 Tilapias and Salmonids: the larger the production; the smaller the diversity Year: ; Area = All; Environment = All; Scope = Aquatic products; Diversity measure (q =1)
70 Some evidence of positive correlation between diversity and population Year: ; Area = All; Environment = All; Scope = Fish; Production measure = Quantity; Diversity measure (q =1)
71 No obvious correlation between diversity and per capita income Year: ; Area = All; Environment = All; Scope = Fish; Production measure = Quantity; Diversity measure (q =1)
 Mediterranean and Black Sea (37) Atlantic, Southwest (41) Atlantic, Southeast (47) Indian Ocean, Western (51) Indian Ocean, Eastern (57) Pacific, Northwest (61)")
72 Aquaculture in Atlantic Ocean (coast) less diversified than Pacific or Indian Ocean (coast) FAO Fishing Areas Atlantic, Northwest (21) Atlantic, Northeast (27) Atlantic, Western Central (31) Atlantic, Eastern Central (34) Mediterranean and Black Sea (37) Atlantic, Southwest (41) Atlantic, Southeast (47) Indian Ocean, Western (51) Indian Ocean, Eastern (57) Pacific, Northwest (61) Pacific, Northeast (67) Pacific, Western Central (71) Pacific, Eastern Central (77) Pacific, Southwest (81) Pacific, Southeast (87)

73 Tilapias: export oriented commodities tend to have less species diversity Year: ; Area = All; Environment = All; Scope = Aquatic products; Diversity measure (q =1)


74 Norway and Chile: Export-oriented countries may have large production yet low diversity

75 Egypt: country with less diverse aquaculture resources may have large production yet low diversity


76 Hong Kong and Singapore: High income cities with strong preference over seafood may have small production yet high diversity

77 Malawi: high diversity because of restriction over introduced species

78 Marine shrimps and prawns: large-scale producers tend to be less species diversified than small-holder producers Year: ; Area = All; Environment = All; Scope = Aquatic products; Diversity measure (q =1)
79 Part III: Use of knowledge and information about species diversification patterns for evidence-based decision making
80 Lessons learned Species diversification patterns are under the influence of many factors. Different countries tend to have different species diversification patterns. A country tends to have different species diversification patterns at different aquaculture development stages. A variety of dimensions need to be specified for species diversification to be properly defined and measured.
81 Remaining questions How can a country learn from other countries experiences in species diversification? What can government learn? What can the private sector learn? How do we know whether a certain species diversification pattern is good or bad for a country? What are other species diversification measures to use? How can species diversification measures be used to help government design proper aquaculture development strategies or make decisions on specific issues such as allocation of public funds to different research activities? How can species diversification measures help farmers select farming species?
82 Part IV: World Aquaculture Performance Indicators (WAPI)

83 Species diversification would become a feature template in the WAPI aquaculture production module
 Data sources utilized FISHSTAT; Food Balance Sheet; FAOSTAT; UN Comtrade; UN Population; IMF WEO; World Bank WDI; FAO Statistics Division; ILO")
; National fishery statistics; FATPs (feed, seed, small scale, etc.")
84 A prototype of World Aquaculture Performance Indicators: a user-friendly tool for evidence-based decision making Scope 233 countries (or territories); 42 country groups; major species groups (FAOSTAT groups) Data sources utilized FISHSTAT; Food Balance Sheet; FAOSTAT; UN Comtrade; UN Population; IMF WEO; World Bank WDI; FAO Statistics Division; ILO databases; China Fishery Statistics Yearbook; Global Aquaculture Performance Index (GAPI); FAO-INFOOD, among others. Data sources untapped FI data (land & water, employment, etc.); National fishery statistics; FATPs (feed, seed, small scale, etc.); Globefish; many others Components Selection menus; Tables & charts; Supporting materials (papers, websites, etc.)
85 Welcome collaboration on WAPI
86 Thank You