Agricultural statistics and AEI
|
|
|
- Kristian Page
- 5 years ago
- Views:
Transcription


1 Agricultural statistics and AEI Laura Aguglia DG AGRI Unit C.3 Farm economics EIONET Meeting 21 June 2018
2 Statistics in DG AGRI Data collection: FADN (Farm Accountancy Data Network) IACS and LPIS (Integrated Administration and Control System - Land Parcel Identification System) CATS (financial data and control data) CMEF (CAP Monitoring and Evaluation Framework Indicators) Others Main uses: Economic analysis (trend and developments) Policy design Modelling/Impact Assessment Monitoring implementation of policy Evaluation of the impact of policy Communication 2
3 The CAP and the environment The Common Agricultural Policy has evolved over time. The CAP has been increasingly adapted for integrating environmental concerns and to serve sustainability purposes better. The integration of environmental concerns into the Common Agricultural Policy is based on: ensuring rules compatible with environmental requirements promoting agricultural practices preserving the environment, climate and the countryside. 3 priority areas for a sustainable management of natural resources : biodiversity and traditional agricultural landscape water management and use climate change 3
4 Cumulative environmental benefits Greening architecture of the CAP Implementation mechanism Greening Cross compliance Rural Development measures Agricultural area (eligible for direct payments) Voluntary with compensation for cost incurred and income forgone Mandatory with financial support (decoupled green payment per hectare) Regulatory (Statutory Management Requirements and Good Agricultural Environmental Conditions) 4
5 A monitoring & evaluation system for the whole CAP (Regulation (EU) No 1306/2013) Measuring CAP performance in relation to its 3 overall objectives: (a) viable food production (e.g. income, productivity, price stability); (b) sustainable management of natural resources and climate action (e.g. GHG, biodiversity, soil and water); (c) balanced development (e.g. rural employment, growth, poverty). MS to provide the EC with all the information necessary to permit the monitoring and evaluation of the measures concerned. As far as possible, information based on established sources of data, such as the Farm Accountancy Data Network and Eurostat. 5
6 A system of indicators linked to policy elements 45 context indicators => Mostly based on statistics CAP general objectives 16 impact indicators => Mostly based on statistics Situation & trends CAP specific objectives (Pillar I specific objectives, Pillar II priorities) 41 result indicators => Based on statistics and monitoring data Pillar I instruments & Pillar II measures The indicators are the starting point from which the MSs and the Commission will be able to measure the size of the CAP and assess if it is well designed 6 84 output indicators => Based on monitoring data
7 THE FUTURE CAP PRIORITIES AT A GLANCE Simplification and modernisation of the CAP Support to the development of a knowledge-based agriculture Higher ambitions on environment and climate A fairer and more effective distribution of support across MS and farmers 7

8 Current and future green architecture 8
9 Strengthening environment and climate action Main change in the CAP related to ENV: Stronger environmental/climate ambition with conditionality, eco-schemes and strategic plans EU sets wide objectives and list of available types of intervention on air, water, soil, biodiversity MS Strategic plans define the pertinent actions to meet EU objectives based on MS specific needs Farmers apply for schemes and comply with stringent environmental criteria defined by EU/MS New Delivery Model Policy oriented to results Reinforced environmental objectives 40% of expenditure contribute to climate goals Conclusion: More reliance on Indicators 9
10 The EU Agri-environmental indicators Agri-environmental indicators (AEIs) track the integration of environmental concerns into the Common Agricultural Policy (CAP) at EU, national and regional levels (COM final) Developed in close collaboration Commission- Member States Aims: provide information on the farmed environment; track the impact of agriculture on the environment; assess the impact of agricultural and environmental policies on environmental management of farms; inform agricultural and environmental policy decisions; illustrate agri-environmental relationships to the broader public.
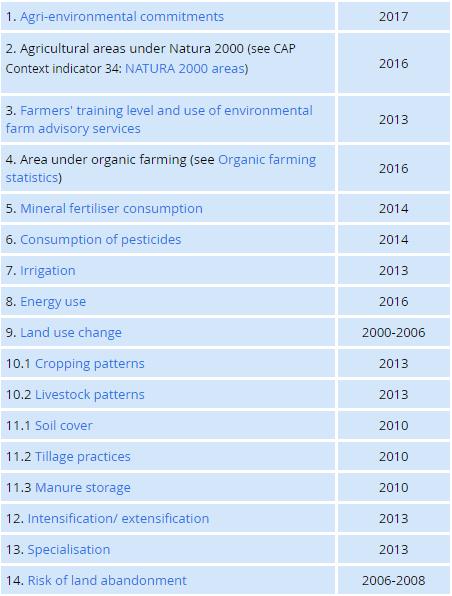
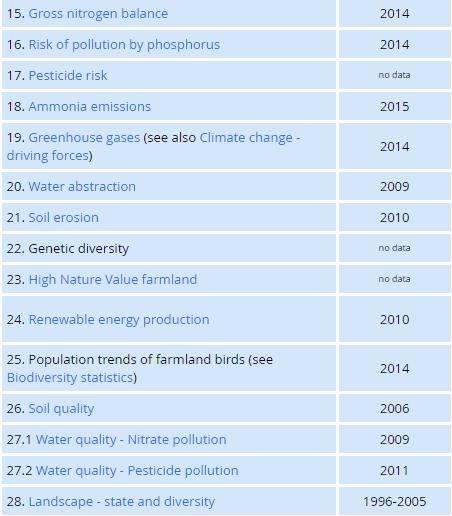
11 The EU Agri-environmental indicators A set of 28 indicators
12 The EU Agri-environmental indicators Context indicator no. CI 31 CI 32 Land cover Name Less favoured areas Impact indicator AEI no. CI 33 Farming intensity 12 CI 34 Natura 2000 areas 2 CI 35 Farmland birds index (FBI) yes 25 CI 36 Conservation status of agricultural habitats (grassland) CI 37 HNV farming yes 23 CI 38 Protected forest CI 39 Water abstraction in agriculture yes 20 CI 40 Water quality yes 27 CI 41 Soil organic matter in arable land yes 26 CI 42 Soil erosion by water yes 21 CI 43 CI 44 Production of renewable energy from agriculture and forestry Energy use in agriculture, forestry and food industry yes 24 CI 45 Emissions from agriculture yes


13 Main data sources for Context/Impact/AEI indicators Others FSS, EAA, Forestry, AGRI JRC EEA Eurostat
14 The EU Agri-environmental indicators What works System built according to DPSIR framework A collaborative effort between: Commission Services (DG AGRI, DG ENV, DG ESTAT, DG JRC) European Environment Agency (EEA), and Other Commission DGs to be included soon (DG SANTE, DG CLIMA) Indicators with stable sources, time series, annual data, quality checks are working What does not work/needs to be improved Some highly theoretical/complex - Need models, expert input, etc Data provision not guaranteed - reliability What is missing: Fitness for purpose and Policy relevance Limited usability of the system (subsets of indicators usable) Limited uptake: only some AEIs are used as CAP context or impact indicators or as Sustainable Development indicators.
15 AEIs for Biodiversity Context indicator no. Name Impact indicator current CAP AEI no. Data Future CAP CI 34 Natura 2000 areas no 2 CI 35 Farmland birds index (FBI) yes 25 CI 36 Conservation status of agricultural habitats (grassland) no Yes (inconsistency) Time series, but weaknesses Linked to reporting rounds ( ) no yes no "status" of species/ habitats CI 37 HNV farming yes 23 no data no CI 38 Protected forest no every 5 years no Genetic diversity no 22 no data no Landscape - state and diversity no 28 discontinued ( ) yes
16 AEIs for Biodiversity What works The only indicator regularly kept is the Farmland Bird Index What does not work well/has to be improved Long term consistency AEIs policy indicators (see CAP example) Data to fill in indicators with content are missing Usable definition and homogeneous methodology of existing indicators We have to live with indicators (e.g. FBI) not satisfactory. What is missing Establishing a sound link between agricultural policies and biodiversity (a system able to reflect on biodiversity vulnerable to many stressors) A consistent and pragmatic framework to monitor biodiversity considering several scales (forces us to revisit, recreate, improvise) Indicators for landscape (landscape features at several scales) in support of biodiversity.
17 AEIs for water Context indicator no. Name Impact indicator current CAP AEI no. Data Future CAP CI 39 Water abstraction in agriculture yes 20 partly WEI+ CI 40 Water quality (nitrates pollution) yes 27 no data yes CI 40 Gross nutrient balance no 15 partly yes Water quality (pesticide pollution) no 27 no data no What Works Data and sound/homogeneous methods exist for some indicators and for some MS What does not work well/has to be improved Spatial and temporal data availability for all MS Methodologies and data sources vary between MS Share of agriculture to problems often not well known What is missing Need to downscale indicators to identify local/seasonal problems
18 To be improved: Harmonisation among policy institutions, among MS, among researchers on definition and methodology Establishing sound links between policy and environment Working more on stable set to answer to policy needs to measure the performance
19 19 Thank you for your attention!