Examining Potential Crop Profitability in 2014 Land Values, Cash Rents & Crop Inputs
|
|
|
- Eric Elliott
- 5 years ago
- Views:
Transcription

1 Examining Potential Crop Profitability in 2014 Land Values, Cash Rents & Crop Inputs Barry Ward Department of Agricultural, Environmental and Development Economics, The Ohio State University 1
2 Ohio Cropland Values Source: NASS 2


3 SW+11% NW+25% SW+18% NW+22% 3
 Indiana - Northern 3/4 Good Farmland Year over Year Increase - 18% (District 7 14%) 3rd Quarter Increase 2% (District 7")
4 Land Survey Data - % Increases OSU AEDE (collected Jan. 2012) Projected Increase for % Purdue (collected June 2013) Indiana Yearly Increase % Chicago Fed (Collected October 1, 2013) Indiana - Northern 3/4 Good Farmland Year over Year Increase - 18% (District 7 14%) 3rd Quarter Increase 2% (District 7 1%) 4
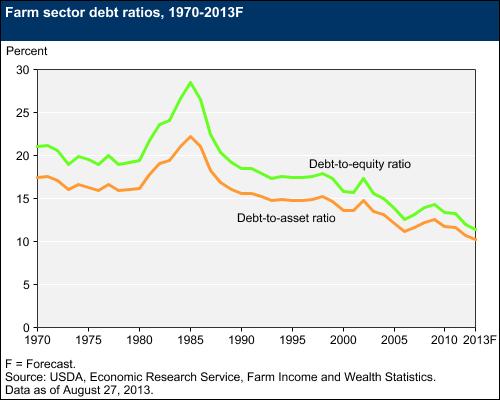
5 What is Driving Land Value? Crop Net Income has been good Farmers balance sheets continue to strengthen U.S. Farm Sector Debt to Asset Ratio 10.2% (D/A Ratio in 2002 was 14.1%) $ s to invest => machinery or land Outside Investors still seeking investment alternatives Low interest rates 10 Year T-Bill 2.5% Local land supply low Land isn t a frequently traded asset possible premium if sold in your geographic comfort zone Land purchased for legacy purposes to secure continued survivability of farm business 5
6 Profits in Grain Production Lead to Land Value and Rent Bull Market 500 Returns to Land Ohio Corn

7 Ten Year T-Bill Rates Source: Yahoo Finance 7
8 8
9 9
10 CORN SELECTED BUDGET STATS Item Input Yield in bushels/acre Receipts Corn Price $4.50 /bushel $ $ Variable Costs Seed Cost $275 /bag $ $ Nitrogen (NH 3 ) $650 /ton $70.41 $82.30 P (MAP) $450 /ton $25.62 $30.74 K 2 0 (Potash) $425 /ton $15.30 $18.36 Chemicals $50.98 $50.98 Fuel/Diesel $3.50 /gallon Breakeven Cost $2.53 $2.29 Fixed Costs Labor and Management $81.00 $88.20 Machinery Cost $ $ Land Rent $ $ Breakeven Cost $5.02 $4.69 Returns Return to Total Costs -$ $37.20 Return to Land $ $
11 SOYBEAN SELECTED BUDGET STATS Item Input Yield in bushels/acre Receipts Soybean Price $11.50 /bushel $ $ Variable Costs Seed Cost $0.43 /1000 seeds $77.40 $77.40 P (MAP) $450 /ton $16.13 $19.35 K 2 0 (Potash) $425 /ton $23.11 $27.72 Chemicals $31.40 $31.40 Fuel/Diesel $3.50 /gallon Fixed Costs Labor and Management $56.80 $62.14 Machinery Cost $ $ Land Rent $ $ Breakeven Cost $12.37 $10.85 Returns Return to Total Costs -$ $2.08 Return to Land $ $
12 WHEAT SELECTED BUDGET STATS Item Input Yield in bushels/acre Receipts Wheat Price $6.50 /bushel $ $ Variable Costs Seed Cost /1000 seeds $43.40 $43.40 N (UAN) 300 $19.63 $55.18 P (MAP) 450 /ton $19.63 $23.44 K 2 0 (Potash) 425 /ton $16.52 $18.35 Chemicals $13.00 $13.00 Fuel/Diesel $3.50 /gallon Fixed Costs Labor and Management $45.90 $50.45 Machinery Cost $ $ Land Rent $ $ Breakeven Cost $8.95 $8.28 Returns Return to Total Costs -$ $90.86 Return to Land $92.31 $
13 CORN SELECTED BUDGET STATS Item Input Yield in bushels/acre Receipts Corn Price $4.50 /bushel $ $ Variable Costs Seed Cost $275 /bag $ $ Nitrogen (NH 3 ) $650 /ton $70.41 $82.30 P (MAP) $450 /ton $27.86 $33.46 K 2 0 (Potash) $425 /ton $16.64 $19.99 Chemicals $50.98 $50.98 Fuel/Diesel $3.50 /gallon Breakeven Cost $2.36 $2.14 Fixed Costs Labor and Management $84.15 $92.03 Machinery Cost $ $ Land Rent $ $ Breakeven Cost $4.68 $4.37 Returns Return to Total Costs -$31.02 $27.04 Return to Land $ $
14 SOYBEAN SELECTED BUDGET STATS Item Input Yield in bushels/acre Receipts Soybean Price $11.50 /bushel $ $ Variable Costs Seed Cost $0.43 /1000 seeds $77.40 $77.40 P (MAP) $450 /ton $15.58 $18.69 K 2 0 (Potash) $425 /ton $22.31 $26.78 Chemicals $31.40 $31.40 Fuel/Diesel $3.50 /gallon Fixed Costs Labor and Management $55.88 $61.05 Machinery Cost $ $ Land Rent $ $ Breakeven Cost $12.76 $10.85 Returns Return to Total Costs -$ $21.16 Return to Land $ $
15 CORN SELECTED BUDGET STATS Item Input Yield in bushels/acre Receipts Corn Price $4.50 /bushel $ $ Variable Costs Seed Cost $275 /bag $ $ Nitrogen (NH 3 ) $650 /ton $70.41 $82.30 P (MAP) $450 /ton $27.86 $33.46 K 2 0 (Potash) $425 /ton $16.64 $19.99 Chemicals $50.98 $50.98 Fuel/Diesel $3.50 /gallon Breakeven Cost $2.36 $2.14 Fixed Costs Labor and Management $84.15 $92.03 Machinery Cost $ $ Land Rent $ $ Breakeven Cost $4.19 $3.83 Returns Return to Total Costs $53.98 $ Return to Land $ $
16 Net Income Method of Capitalization Return to Land / Cap. Rate = Appraised Land Value Corn Yield $ / 2.50% = $4, $ / 2.50% = $8, $ / 4.00% = $2, $ / 4.00% = $5,
17 17
18 SW-14% SW-11% 18
19 Land Values/Cash Rents Northwest Northwest Ohio Results 2013 Land Class Average Range* Average Avg Corn Yield (bu/a) Market Value per Acre $6,960 $8,034 $5,885 Rent per Acre $196 $227 $166 Top Avg Corn Yield (bu/a) Market Value per Acre $8,579 $10,071 $7,088 Rent per Acre $260 $302 $218 Poor Avg Corn Yield (bu/a) Market Value per Acre $5,488 $6,810 $4,167 Rent per Acre $141 $161 $121 19
20 Land Values/Cash Rents Southwest Southwest Ohio Results 2013 Land Class Average Range* Average Avg Corn Yield (bu/a) Market Value per Acre $7,170 $9,068 $5,273 Rent per Acre $228 $272 $183 Top Avg Corn Yield (bu/a) Market Value per Acre $8,455 $10,990 $5,921 Rent per Acre $300 $356 $245 Poor Avg Corn Yield (bu/a) Market Value per Acre $5,790 $7,271 $4,309 Rent per Acre $166 $214 $119 20
21 Producers Advantage - Information Farmers have detailed production knowledge, yield and profit data Non-farming landowners often have little production knowledge and little to no yield and profit data so Even armed with a set of cash rent survey data, little to no knowledge of the farm s production capabilities leaves a landowner relatively unarmed. Some landowners are including data sharing to be included in the written lease agreement Yield data, fertility data, cost data, profit data 21
22 Producers Potential Disadvantage Normalizing Profits Managing Rapidly Increasing Cash Rents o Negotiate rents at or near the market o Communicating with Landowners of the potential for Returns to normalize and rents to decrease o Communicate the value of non-cash benefits to the landowner o Strengthen Balance Sheet to survive a reversal o Flexible cash leases 22
23 Advantages and Disadvantages of Flexible Cash Renting Advantages: 1.Flexible cash rent enables the landowner to share in the additional income that results from unexpected increases in the prices of crops considered in the rent-adjustment clause. If the cash rent also is flexed for changes in yields, the landowner will benefit from above-normal yields regardless of the cause. 2.For the operator, risk is reduced. Cash-rent expense is potentially lower if crop prices or yields are less than normal. 3.Calculating flexible cash rent requires more communication from both parties. 4. For the operator, a flex lease may minimize loss of rented land base due to being outbid for inadequate market adjustments 23
24 Advantages and Disadvantages of Flexible Cash Renting Disadvantages: 1.For the landowner, flexible cash rent increases risk. 2.Windfall profits that may be realized by the operator from unexpected price increases are reduced. 3.If cash rent is flexed according to yield, the landowner becomes more concerned with the level of crop yields as well as the accuracy of reported yields. Yields must be verifiable and segregated for each land unit in the lease. 4.If cash rent is flexed according to yield, the operator may give up part of the benefits from higher yields resulting from managerial input, thus possibly reducing incentives to maximize profits. 5.Calculating flexible cash rent requires more management from both parties. There must be agreement on how to verify the factors that are used to set the rent each year. 24
25 Practical Flexible Cash Farm Lease Percent of Gross Income Approach Tenant and Landowner agree on: Base Rent (and Max Rent?) How to calculate and Verify Actual Year-End Revenue Yield and Price verification Percent of gross income as rent 25
26 Practical Flexible Cash Farm Lease Percent of Gross Income Approach Example: Base Rent: $195 Percent of Gross Income as Rent: Corn - 27% Soybeans - 35% Actual Revenue: Corn - $825 (150bpa*$5.50) Soybeans $625 (50bpa*$12.50) Rent: Corn - $975*27% = $223/a Soybeans - $625*35% = $219.00/a 26
27 Energy Information Administration November 2013 Estimates WTI Crude ($/brl) % -2.80% Brent Crude ($/brl) % -4.64% Gasoline ($/gal) % -3.14% Diesel ($/gal) % -4.60% Nat. Gas ($/mcf) % 9.63% 27
28 Current Ohio Fertilizer Prices NH3 $ (-24%) UAN(28%) $ (-15%) MAP $ (-17%) Potash $ (-25%) 28
29 Nitrogen Factors that may lead to N price increases: + Large corn acreage prospects for the U.S. again + Strong crop farm balance sheets Factors that may lead to N price decreases: - Lower crop prices leading to tighter margins - More domestic N production online Giesmer, La; Donaldsville, La; Augusta, Ga; etc. - More domestic N production being built or in a planning stage Over 30 proposed greenfield builds or brownfield expansions 29
30 Phosphorous Factors that may lead to P price increases: + Strong crop farm balance sheets Factors that may lead to P price decreases: - Lower crop prices leading to tighter margins - Lower N prices - Ma den P production at or about at full capacity 30
31 Potash Factors that may lead to K price increases: + Strong crop farm balance sheets + Canpotex members may curtail production Factors that may lead to K price decreases: - Lower crop prices leading to tighter margins - Belarusian Potash Corp. breakup increases potash available on the global market 31
32 Crop Input Costs Energy Modestly Lower Fertilizer Lower Seed Flat to Modestly Higher Chemical Flat to Modestly Higher 32

33 Barry Ward (614)