O NOT COPY. Simulation of post-rainy sorghum yield response to N fertilization in India. By Swarna Ronanki (ICAR-IIMR) & Jana Kholova (ICRISAT)
|
|
|
- Dwight Shaw
- 5 years ago
- Views:
Transcription
1 Simulation of post-rainy sorghum yield response to N fertilization in India By Swarna Ronanki (ICAR-IIMR) & Jana Kholova (ICRISAT) Sorghum in 21 st Century, April 9-12, 2018 Cape Town, South Africa
2 Overview: Sorghum Indian Context Methodology Experiment findings Summary Way forward


, seasons")

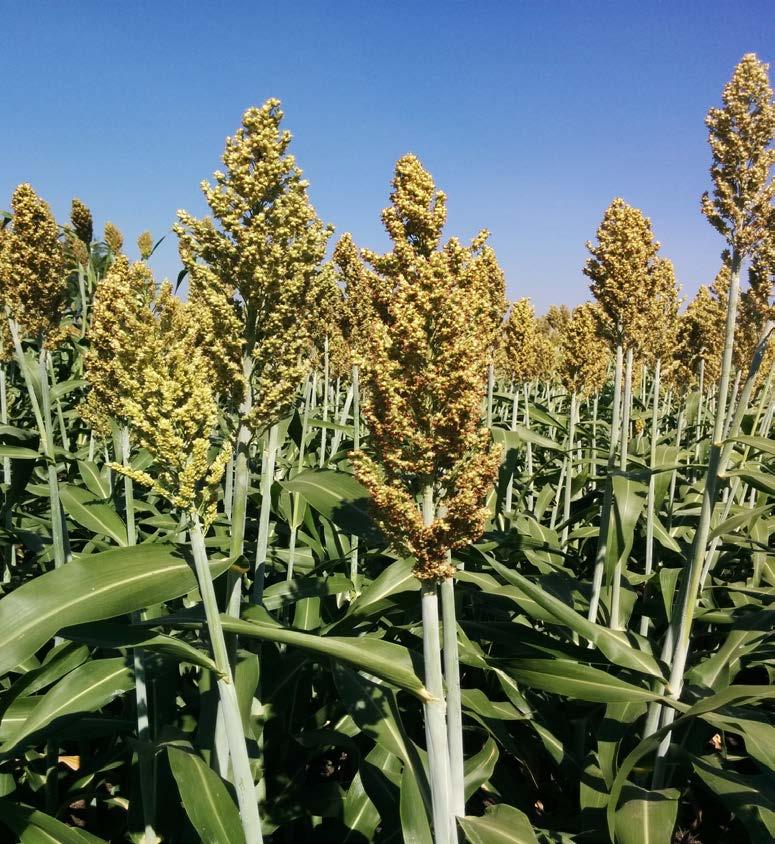
3 Sorghum (Great Millet) Sorghum Multipurpose cereal crop - Source of food, feed, forage and fuel crop Staple crop of poverty threatened small holder farmers. Grown in rainy (kharif), seasons post-rainy (rabi) seasons & summer Suitable crop for Climate change scenario in the semi-arid tropics Nutritional and health benefits

4 Post rainy sorghum Post-rainy sorghum highly valued food grain marginal growing conditions changing climate scenario Farmer s yields stagnate at ~800kg/ha Yieldpotential ~3500kg/ha Low input agronomic practice, frequent droughts caused by climatic variability.
5 Bridge this yield gap by GxExM Testing GxExM experientally in field reflects ground reality Limited by no. of seasons, sites, cultivars & management combinations Crop simulation models capture scenarios Require prediction methods that combine the products of genetic gain & management optimization to close yield gap (Mark Cooper pptn) Apsim - decision support tool to design suitable crop and management interventions. M G YIELD E
6 In-silico experiment: Simulation of post-rainy sorghum yield response to N fertilization in India Target system: India; RABI sorghum major production areas Situation: Rainfed, marginal land - low input agriculture practice. Questions: Can increased dose of N enhance the rabi sorghum production; where? Tools: Sorghum module; APSIM platform (v 7.6)


7 Andhra Pradesh, 7% Karnataka, 28% Tamil Nadu, 2% Gujarat, 1% Maharashtra, 62% Rabi sorghum production tract in India Kholova et al., 2013
8 Drought stress scenarios: Effect on yield Fig. 1.Trajectories of crop water stress progress (S/D index) through the crop cycle weighed yield (kg/ha) vegetative pre-flowering post-flowering post-flowering relieved mild stress average yield vegetative pre-flowering post-flowering post-flowering relieved mild stress Fig. 2. Effect of water stress on yield Kholova et al., 2013
9 Methodology Districts of major rabi production region Sorghum module in APSIM Genotype M 35-1 Parameterized & validated (Ravi Kumar et al., 2009) Soil database (NBSS-LUP, ISRIC) 50 years of Marksim meteorological data Sowing window 25 Sep to 15 Oct Plant density 12 plants m -2
10 Scenarios tested 1) Low Nitrogen (LN): 20kg urea/ha as starter dose and 20kg urea/ha as top dressing 2) High Nitrogen (HN): 150 kg DAP/ha as starter dose and 100 kg urea/ha as top dressing
11 Question: Can increased dose of N enhance the rabi sorghum production; where?
12 Yield difference between LN& HN (kg/ha) Grain yield difference; Low N practice versus high N practice Yield gain due to HN Yield loss due to HN Yield benefits threshold Yield, LN practice (kg/ha)
13 Yield difference; LN practice versus HN practice Yield loss due to HN Yield gain due to HN Yield difference (kg/ha)between HN and LN practice
14 Frequency of years with yield advantage Higher loss frequency due to HN Higher gain frequency due to HN
15 Leaf area index Crop growth dynamics; farmers practice versus on-station N practice LAI (LN) LAI (HN) GY (LN) GY (HN) LAI (FP) LAI (ON) GY (FP) GY (ON) 1000 HN LN Thermal time interval OS-crop fail to yield due to early water depletion S/D Grain yield (kg/ha) Severe water stress SD(FP) S/D (LN) HN SD(ON) S/D (HN) Thermal time interval LN
16 Summary: Loss in grain yield due to HN in majority of districts Under water stress, larger canopy in HN practice leads to early water depletion and crop failure

17 Way Forward Observed Weather data
 100")
18 Synthetic data ( MARKSIM / NASA) km


19 Towards More granularity Synthetic weather data 30 30km
20 NASA data y = x R² = Temperature ( o c) y = x R² = y = x R² = Observed data Validation of NASA weather data NASA data Rainfall y = x R² = y = x R² = Observed data
21 Parameterisation of rabi sorghum cultivars CSV 14R Phule Chitra CSV 18 CSV 22R CSV 26R CSV 29 R Phule Anuradha Parbhani Moti PKV kranthi Phule Revathi CSV 216 R Phule Moulee M 35-1 Phule Vasudha Phule Suchitra


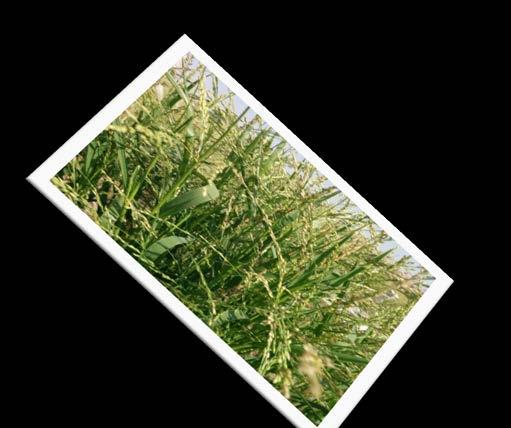
22 Well watered condition Field experiments for parameterisation Water stress condition


23