We re looking for residue Have you seen any?
|
|
|
- Adam Franklin
- 5 years ago
- Views:
Transcription


1 We re looking for residue Have you seen any? Delaware s Cropland Transect Survey Marcia Fox & Tyler Monteith DNREC Watershed Assessment and Management Section

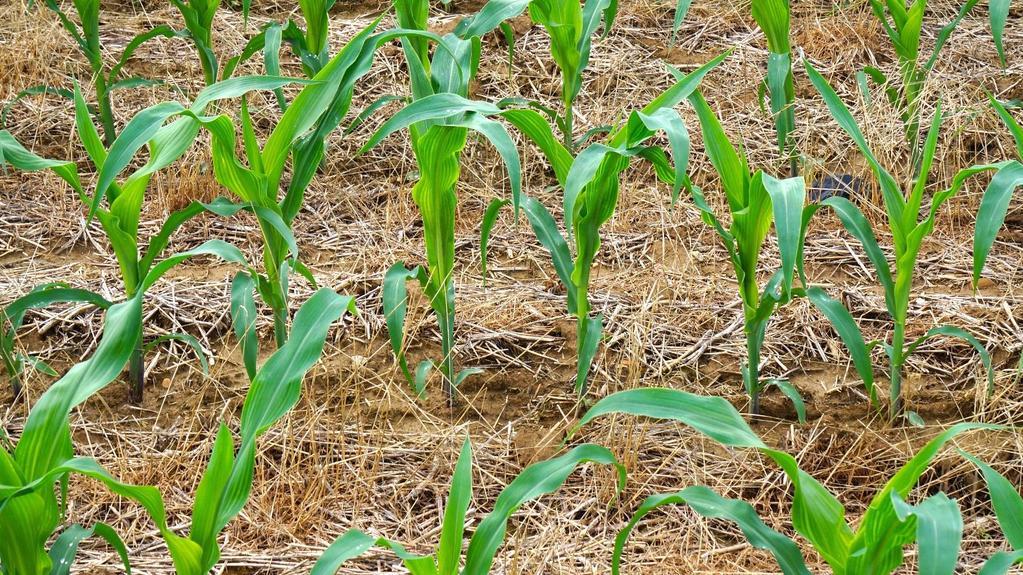
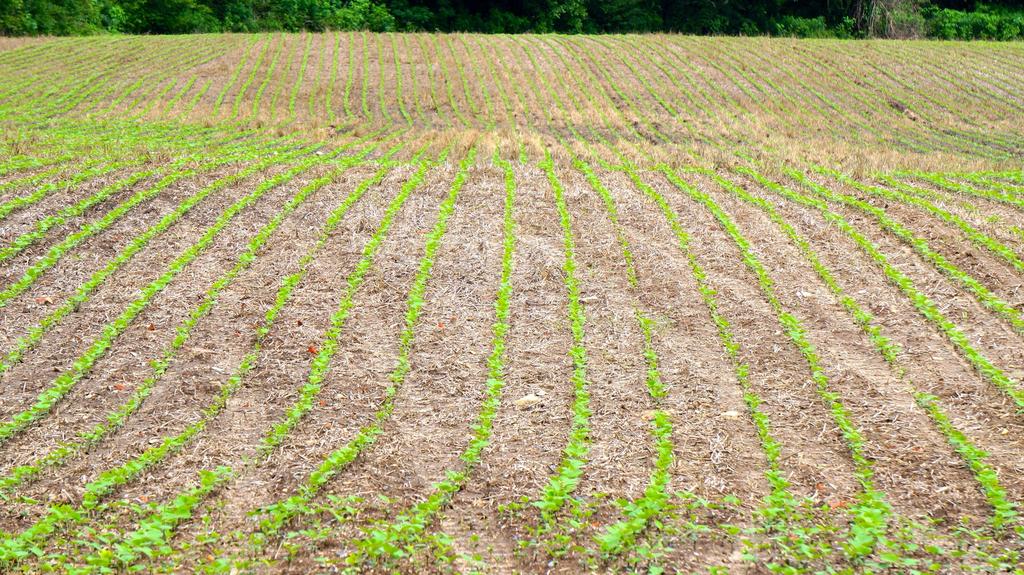
2 Why residue? What is residue? Leftover crops from previous plantings Stalks, stems, stubble, leaves, other crops, seed pods Why is residue important? Increased water infiltration and storage Decreased soil erosion and soil-bound nutrient losses Increased nitrogen retention due to increased organic matter Why are we looking for it? Nutrient reduction credits from the Chesapeake Bay Program Currently underreported in Chesapeake Bay Progress Submissions

3
4
5 Previous Tillage Practice Reporting Previously using historic Conservation Technical Information Center (CTIC) Privatization of CTIC caused a data shortage and lack of data updates Hasn t been updated since 2004 Cons-Till was being simulated by Chesapeake Bay Program Watershed Model Applied a default amount of conservation-tillage based on land-use This means loss in cons-till credit due to loss in agricultural land-use from Chesapeake Bay Program projections Only reporting: Conservation Tillage (+30% residue at planting) Continuous No-Till (applied as an efficiency on top of CT land-use)


6 We rely on Conservation Tillage Practices in our WIP! Courtesy of Matt Johnston, UMD Chesapeake Bay Program Office 6
7 180,000 Reported Conservation-Tillage (acres) 160, , , ,000 80,000 60,000 40,000 20,000 0

8 New HRMSD Category Conservation Tillage Panel Greatest benefit for water quality found when crop reside >60% Created new practice High- Residue, Minimum Soil Disturbance Reduced TSS by 64% Replaces continuous no-till practice
9

10 Adoption of CTIC Study and Goals Creation of consistent source of data for tillage practices Source of a substantial portion of our load reductions in WIP Include the incorporation of HRMSD practice for further reductions Adopted PA survey from CTIC Delawarized it! Collect unaccounted cover crop data Traditional vs. Commodity Cost shared vs. Non-cost shared
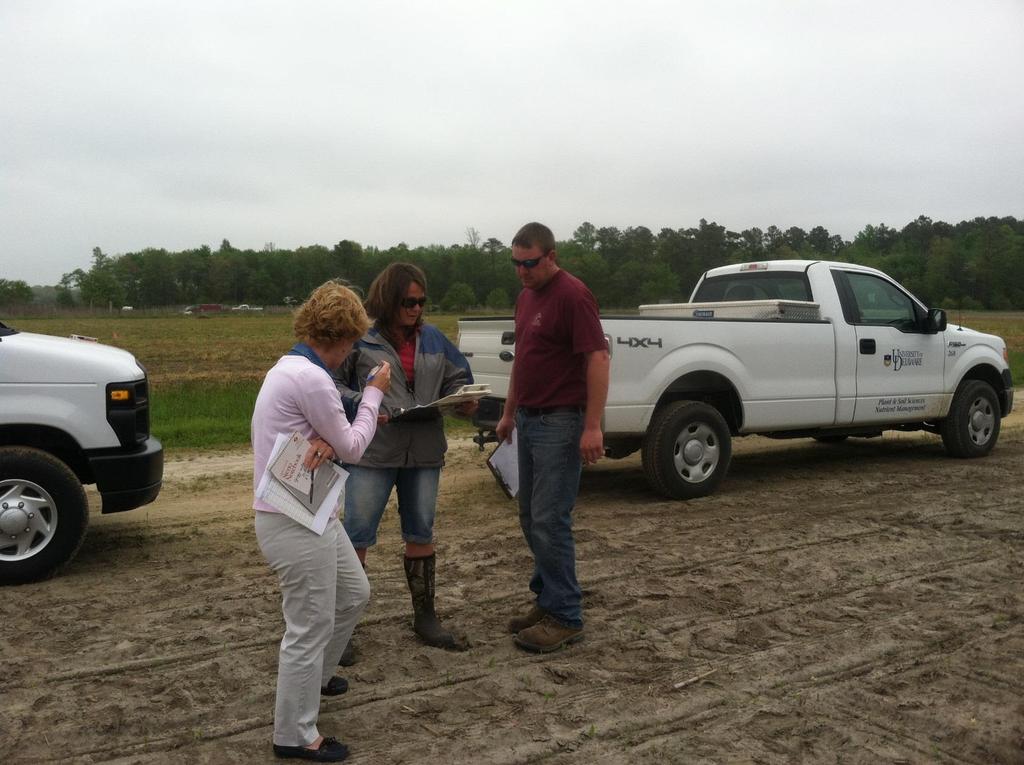
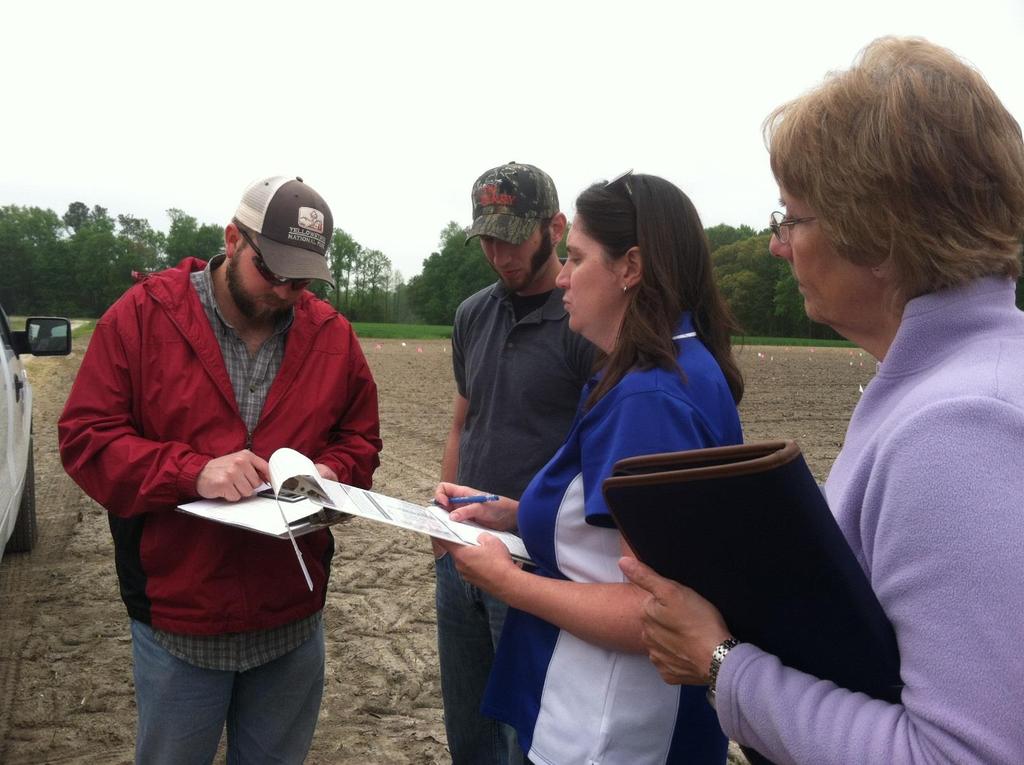
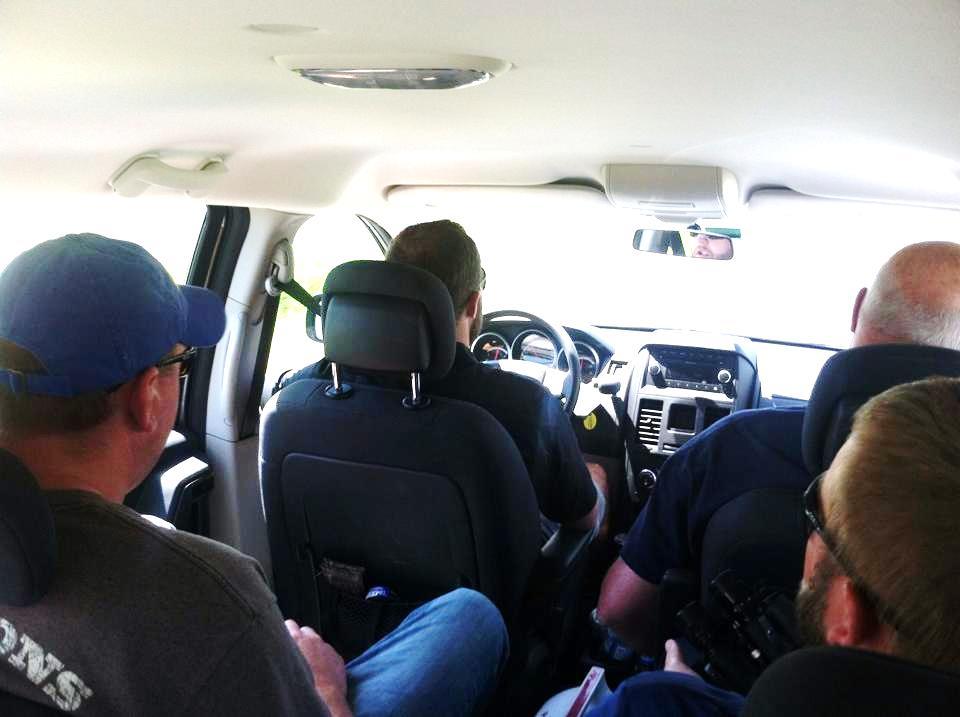
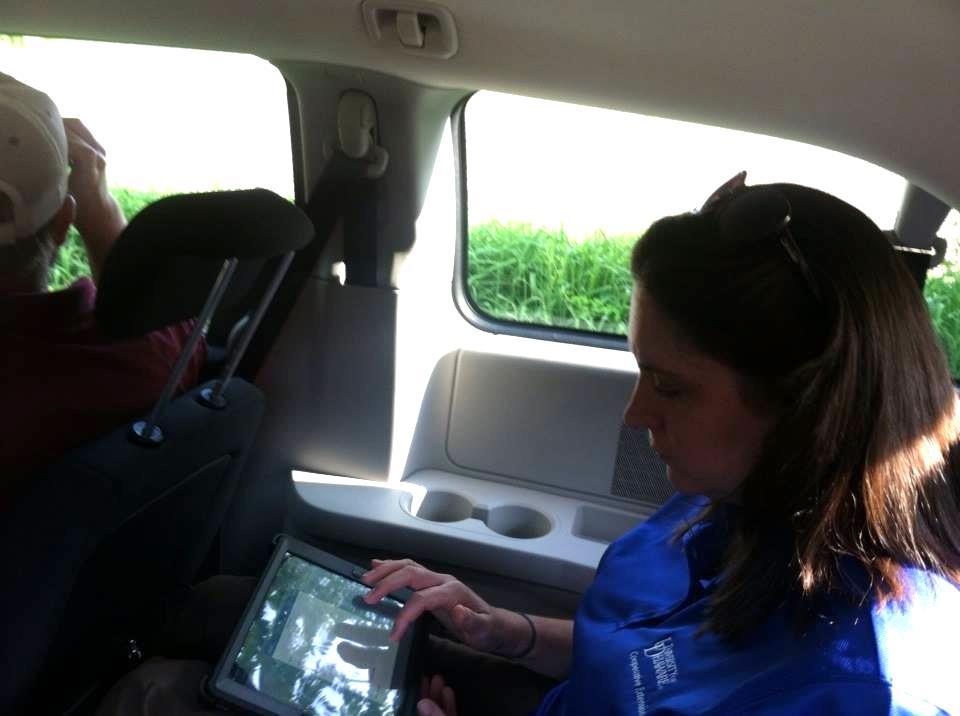
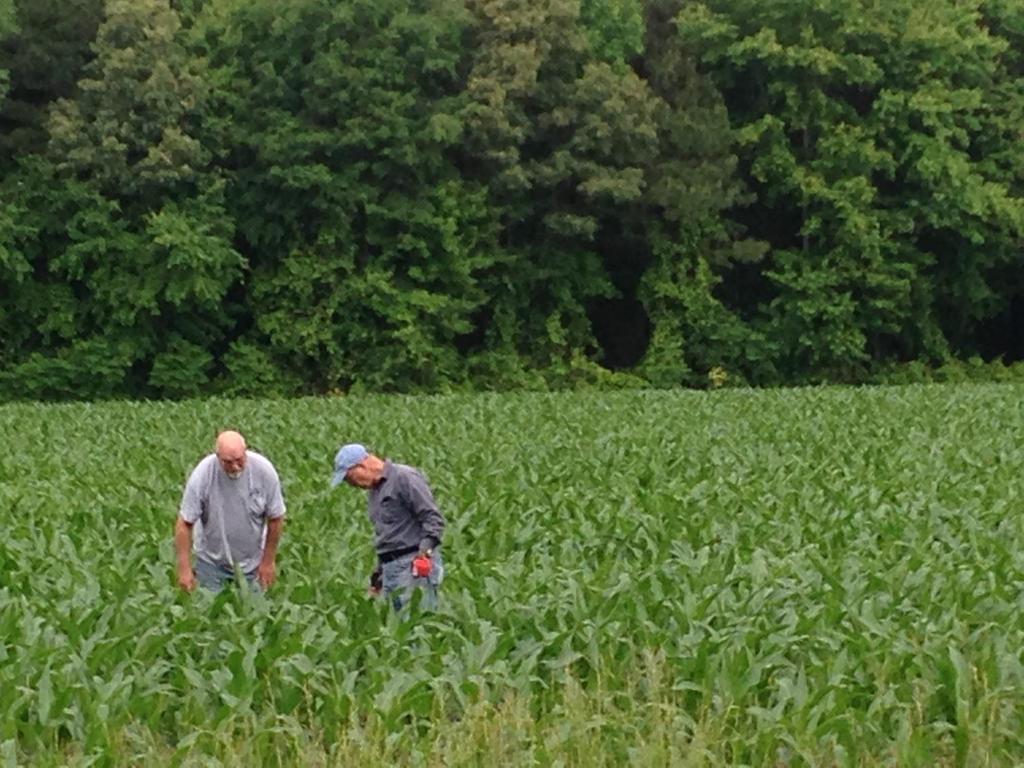
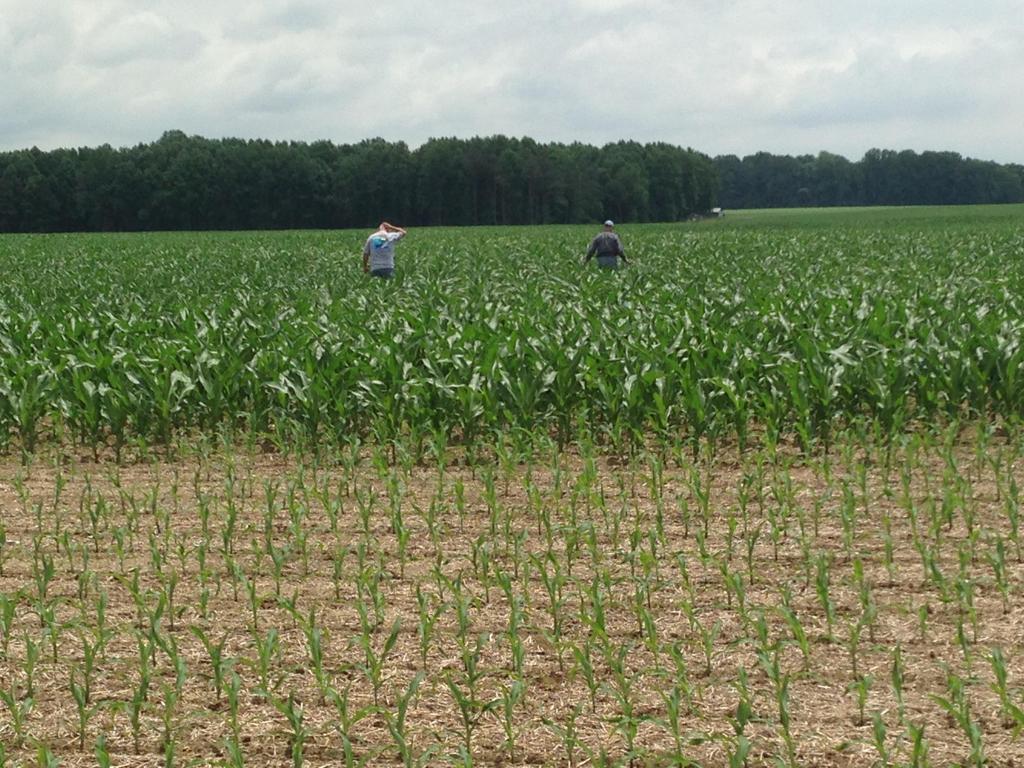
11 Establishing a Statistically Valid Transect Procedure 110 miles along predominately cropland After majority of main crops planted, but before crop canopy closes Windshield Observations Driver, Navigator, Recorder, Observers QA/QC Team involving similar participants Need approximately 460 observations Make stops at specified intervals (.2-.5 miles) and observe both sides of road
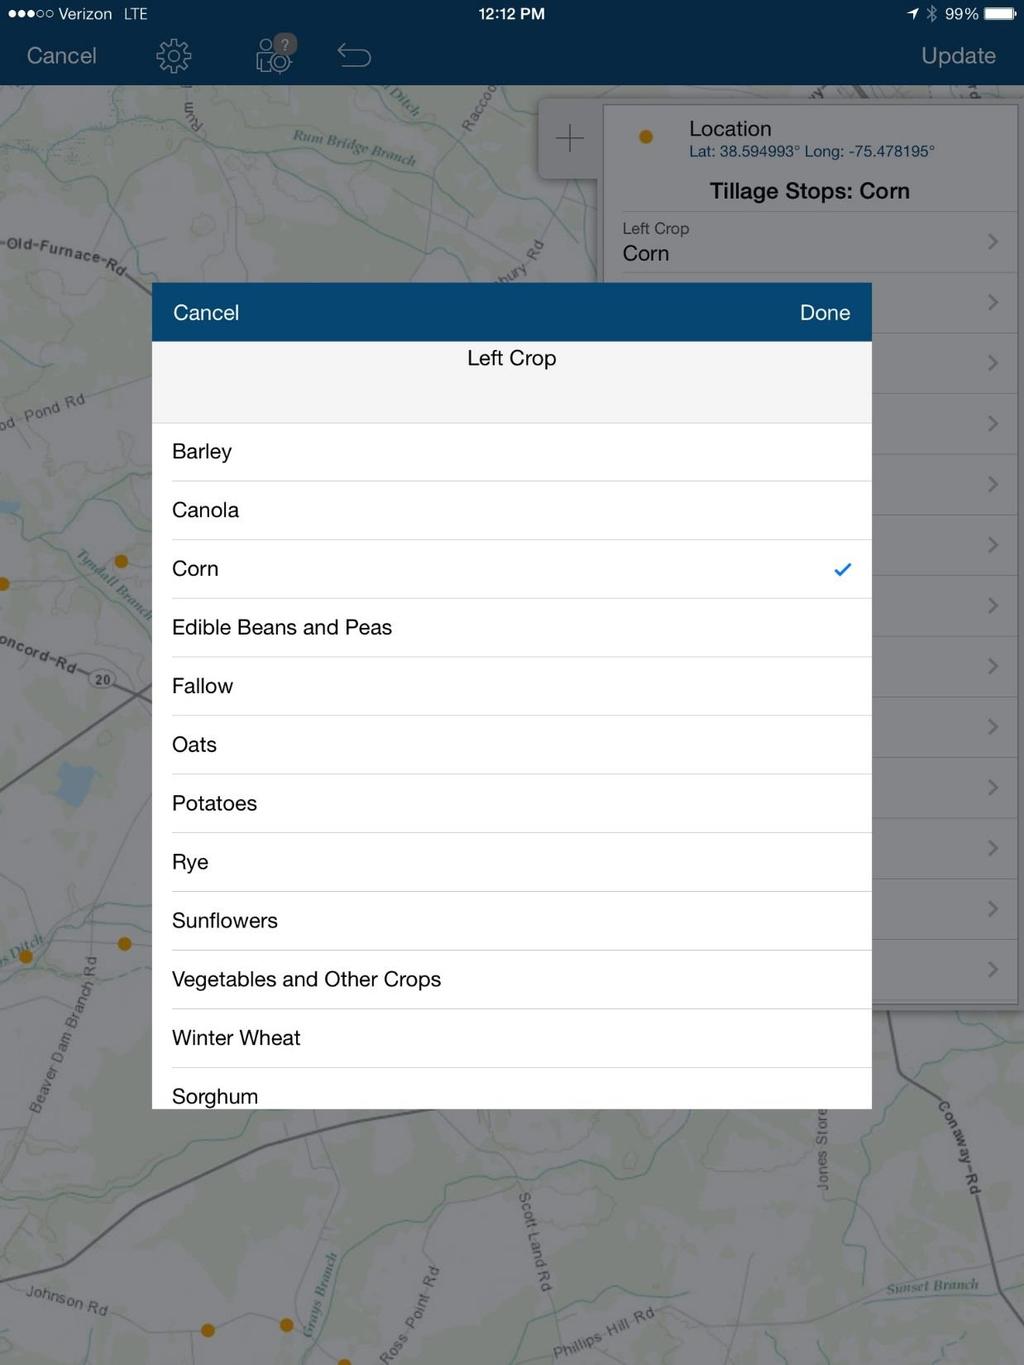
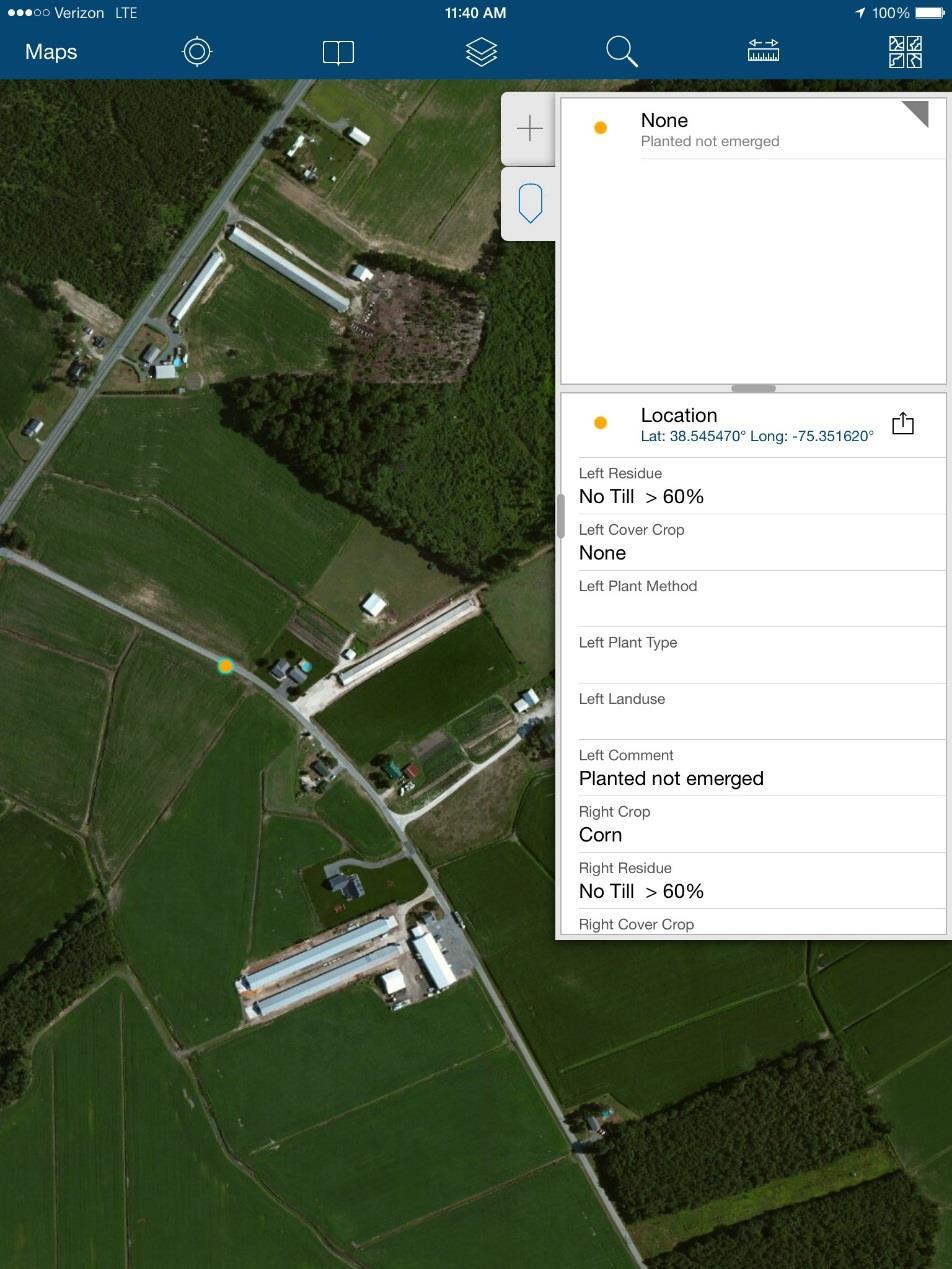
12 CROPS LAND-USE KEY corn edible beans and peas CODE DESCRIPTION soybeans (full season) barley AGRICULTURAL soybeans (double-cropped) canola AFO Animal feeding operations (barnyard) winter wheat forage crop (seeding year only) PR Pasture with riparian area (unfenced stream) oats potatoes AP All other pasture grain (other) sorghum ALF Alfalfa (includes mixed with other seed combos) sunflowers permanent pasture GR Grass (for hay) vegetables and other crops fallow AOC All other crops (those not included in survey) (treefarm) rye hay FCRP Fallow and CRP specialty crops (orchard, sod,..) none Cover Crops NON-AGRICULTURAL Annual Ryegrass (ARG) Annual legume CM Construction/mining Brassica (winter hardy) Forage Radish DI Developed-impervious (over 30% impervious) Triticale Oats (winter hardy) DP Developed-pervious (under 30% impervious) Rye (Ref. Species) Annual Legume + Grass FOR Forest (undisturbed) Oats (winter killed) Forage Radish + Grass FD WB Forest- disturbed (more than one road or currently Water bodies Cover Crop Planting Method Drill Broadcast Aerial Other Please contact Marcia Fox ( ) or Mark Dubin (###-###- ####) with any questions en route or after. A list of survey team contact information may also be found on back. Don't forget to make notes indicate (1) breaks in route, (2) route changes, (3)extended intervals to obtain observations or (4) other pertinent information on the line immediately following the most recent observation. Also make note on map of changes indicating reference point (ie. A-12 (page A, point 12)etc).

13 How It All Went Down (February) Met with Ag Partners in February NRCS FSA UD Coop Ext Soil & Water Cons Dist DDA DNREC Introduced idea of survey Worth out time and efforts? Would results improve our current crediting? Partner agencies willing to donate time and staff?

14 Original Planning Meeting (March) Collaborative decision of survey teams & dates of survey Utilized knowledge of planting times and current conditions from ag partners Drawing of survey routes Broke up by county Made sure to hit most ag land as possible without double-backing Adaptive Management! Always prepared to change
15

16

17

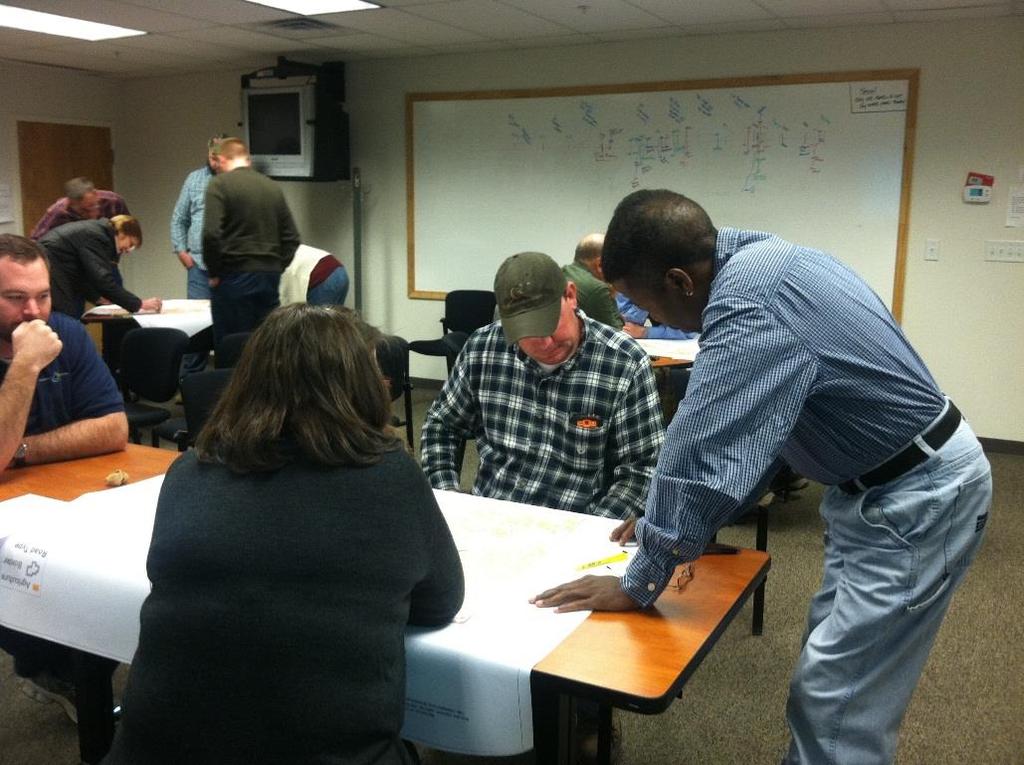
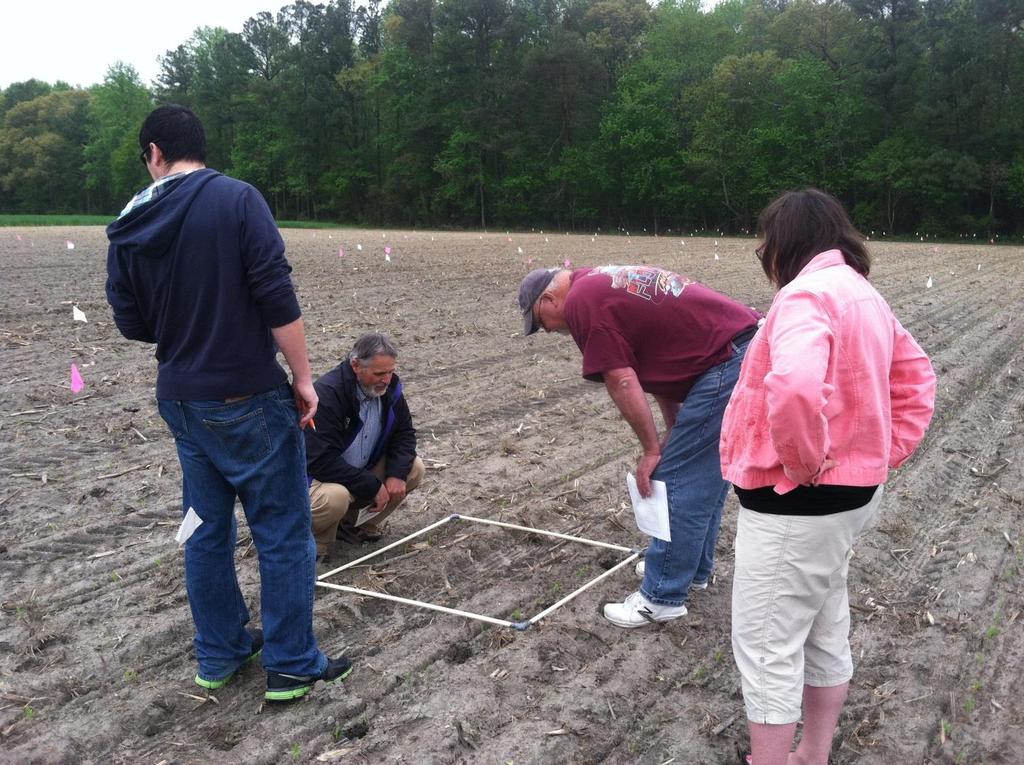
18 Training (May) Classroom session Survey details Measuring techniques Outdoor session Field observations and calibrations Tested fields with varying crops and levels of residue at UD Coop Bead, calculation, and quadrat test

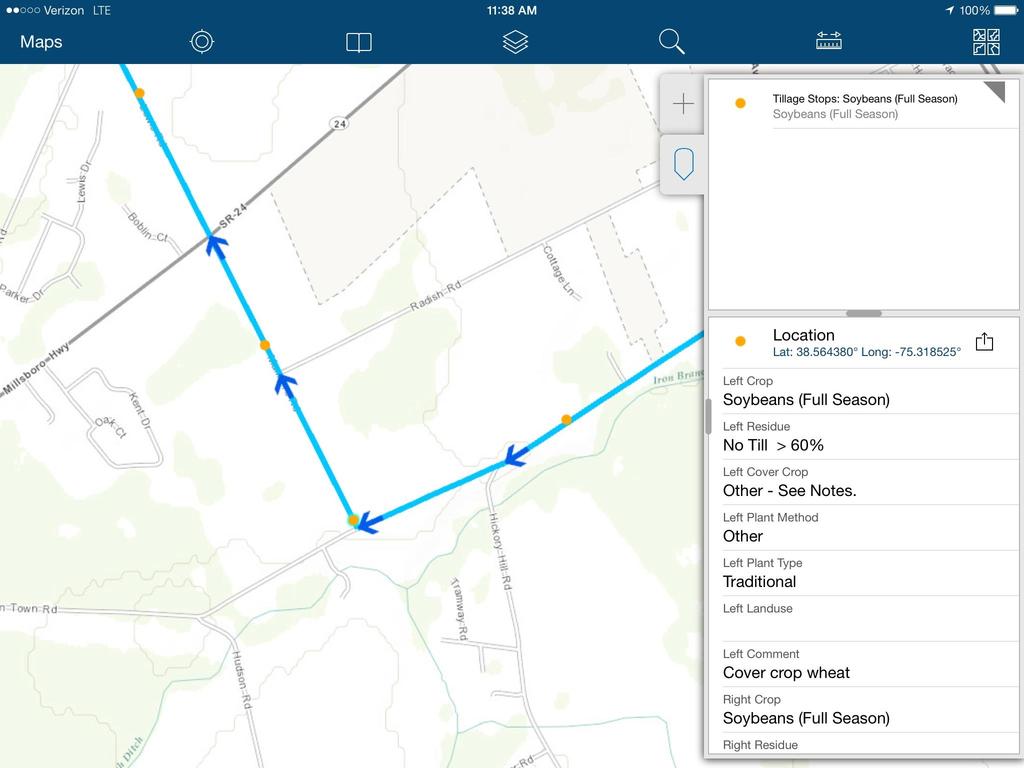
19
20
21
22

23
24
25 Data Recording

26 App Development (May) Developed an app with IT department utilizing ESRI ArcCollector (GIS) Supported by Android or ios Collected and updated data in the field Streamlined recording for faster and more reliable entry Downloadable through Apple s App Store Purchased ipads for data collection
27
28
29
30
31 Survey Time! (June)

32 New Castle County 133 miles 470 observations Kent County 206 miles 504 observations Sussex County 202 miles 497 observations

33 Survey Stats Spent approximately 72 hours in the van over 6 days for the whole team (Observers & QA/QC) Drove 1,082 miles of strictly transect Almost equivalent of driving from Dover, DE to Miami, FL Total of 1,974 vehicle stops

34
35
36
37
38
39 Results 100% New Castle County 90% 80% 70% 60% 78% 50% 40% 50% 22% 30% 20% 28% 10% 0% High Res Min Dist no-till 8% No-till 30-60% Reduced Till 15-30% 14% Conventional Till <15% 0% Unknown
40 100% Kent County 90% 80% 70% 67% 60% 50% 54% 40% 34% 30% 20% 25% 10% 0% High Res Min Dist no-till 13% 8% No-till 30-60% Reduced Till 15-30% Conventional Till <15% 1% Unknown
41 100% Sussex County 90% 80% 70% 60% 50% 57% 43% 40% 39% 30% 32% 20% 10% 0% High Res Min Dist no-till 18% 11% No-till 30-60% Reduced Till 15-30% Conventional Till <15% 0% Unknown
42 100% State-Wide Implementation 90% 80% 70% 60% 67% 50% 33% 40% 48% 30% 20% 19% 24% 10% 0% High Res Min Dist no-till 9% No-till 30-60% Reduced Till 15-30% Conventional Till <15% 0% Unknown
43 100.0% Historic Conservation Tillage 90.0% 80.0% 70.0% 60.0% 66.3% 78.1% 70.9% 60.0% 66.9% 74.9% 71.1% 62.6% 57.3% 70.7% 60.3% 67.4% 50.0% 49.9% 50.4% 51.3% 40.0% 40.9% 30.0% 20.0% 10.0% 0.0% New Castle Kent Sussex State
44 Applied Acreages High-Residue, Min Soil Disturbance Conservation- Tillage Conventional Tillage New Castle County 28, , , Kent County 79, , , Sussex County 91, , , Total 199, , ,934.39
 41.7% HRMSD 18.9% Conservation Tillage 39.")
45 Chesapeake Bay Watershed (43.24% of Observations) 47.5% HRMSD 17.3% Conservation Tillage 35.2% Conventional Tillage Delaware Bay (48.13% of Observations) 49.3% HRMSD 21.3% Conservation Tillage 29.3% Conventional Tillage Inland Bays (8.63% of Observations) 41.7% HRMSD 18.9% Conservation Tillage 39.4% Conventional Tillage
46 100.0% 2014 Spring Cover Crop Survey 90.0% 80.0% 70.0% 60.0% 50.0% 40.0% 39.9% 30.0% 20.0% 10.0% 0.0% 26.5% 21.7% 26.2% 19.1% 20.2% 13.7% 1.5% 7.4% New Castle County Kent County Sussex County Traditional Commodity
47 100.00% 2014 Cover Crop Survey 90.00% 80.00% 70.00% 60.00% 50.00% 41.27% 40.00% 30.18% 30.00% 21.91% 20.00% 10.00% 0.00% New Castle Kent Sussex Barley Forage Radish Forage Radish + Grass Rye Triticale Winter Wheat
48 100.00% Cover Crop Survey Comparison 90.00% 80.00% 70.00% 60.00% 50.00% 40.00% 39.90% 41.27% 30.00% 20.00% 21.70% 21.91% 26.50% 30.18% 10.00% 0.00% New Castle Kent Sussex Spring 2014 Fall 2014
49 2014 Applied Acreages of Cover Crops New Castle Kent Sussex Cover Crop Observations (%) 21.91% 41.27% 30.18% Harvest Cropland (acres) 53,507 Acres 141,758 Acres 226,056 Acres Estimated Cover Crop Coverage (acres) 11, Acres 58, Acres 68, Acres
50 Future Efforts, Modifications, and Reporting Met with Ag Partners in November Discussed Winter Cover Crop Survey Conducted December 1 st Agreed to conduct residue survey in 2015 Modifications to app Submitted 2014 Residue Data to Chesapeake Bay Program County-wide implementation percentages submitted for progress runs Data will be provided to CTIC Currently unable to accept data
51 Conclusions What does this all mean? Many farmers are doing the right thing not for the Bay or water quality but for their own benefit Economics Soil Health We need to conduct annual surveys to capture on the ground changes Data can be used to target programs for audiences (ie. vegetable growers or plain sect farmers) or areas (watershed, highly erodible land)


52 For More Information, Please Contact: Marcia Fox, Tyler Monteith, Head Observers - Ben Coverdale (DDA) & Shawn Tingle (UD) QA/QC Expert Dr. Richard Taylor (UD)