Biochar and GHG mitigation
|
|
|
- Darrell Hutchinson
- 5 years ago
- Views:
Transcription


1 Biochar and GHG mitigation Which are the Trade Offs? Kor Zwart Rathenau Instituut, 12 december 2013

2 Alterra Introduction Wageningen UR University 6 Research Institutes Alterra: Soil, Water & Climate, Ecology, Landscape Ca. 500 staff Project Organisation Million /year Team: Sustainable Soil Management
3 Kor Zwart Introduction Biobased Economy Bioenergy, sustainability, Biochar application Biorefinery New Organic Fertilizers from waste Nitrates Directive evaluation in EU-27 Sustainable Soil Management


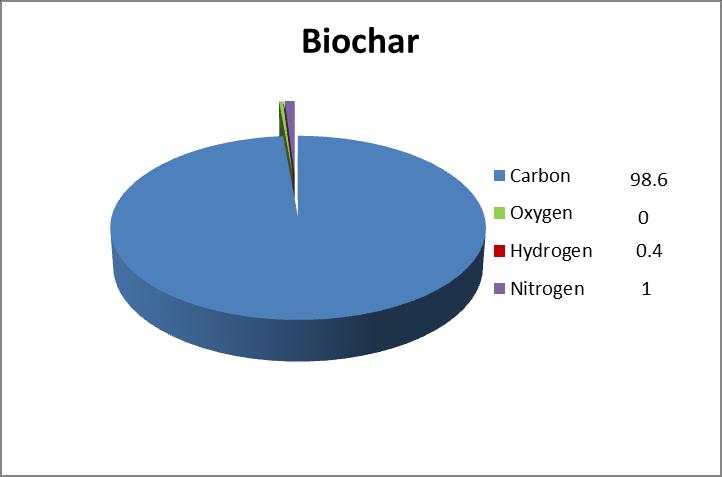
4 Biochar Introduction Carbonized biomass specifically produced to be applied into the soil

")

5 Terra preta (Black soils) Amazon Basin
 Amazon")
6 Terra preta (Black soils) Amazon Basin


7 Pyrolysis Proces -> Biochar
8 Biochar Yields % kg DM -1 Pyrolysis Commercial Softwood Pellets Anaerobic Digestate Mixed Wood Chip Green Waste Char Yield Carbon Liquid Yield Syngas Yield Markus Roedger, Biochar Climate Saving Soils
9 GHG mitigation concept of biochar


10 Current situation

11 Biochar Concept model
12 Trade offs / Considerations Biochar for climate mitigation? Which are the important questions to be addressed?
13 Trade offs / Considerations Biochar stability > 100 years? Is biochar improving Soil fertility / Soil quality and how? Biochar C for energy or for C-sequestration?
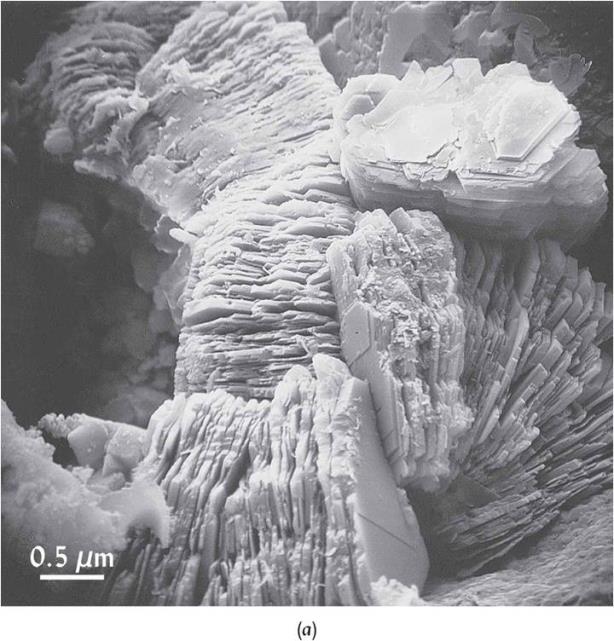
14 Stability of biochar Biochar properties
15 Reed and McLaughlin North American Biochar 2009
16 Pyrolysis conditions Activated C: m 2 /g Keiluweit et al, (2010) Environ. Sci. Technol.
")

17 Spokas (2010) Carbon Management (2010) 1(2)
18 Conclusions stability Stable biochar can be produced, fits C-sequestration in soils Stability depends on pyrolysis conditions -> biochar composition Composition also determines other biochar properties
19 Role of biochar in soil properties and functions

20 SOM and BIOCHAR - Algebra Biochar = organic carbon SOM = organic carbon Biochar = SOM?
21 Role of SOM Biology Source of energy Source of carbon, nutrients Resilience soil-plant system Physics Soil structure Water retention Thermal properties Chemistry CEC Buffer capacity Complexation SOIL ORGANIC MATTER After Baldock and Skjemstad, 1999
22 Clay content Role of SOM in SOIL types CLAY 100% 80% 60% 40% 20% Soluble Particulate Humus Inert SAND 0% CEC Soil structure Energy for biological processes Provision of Nutrients Soil Temperature After:
23 Biochar Claims in Soil Properties Microbiology, nutrient delivery Water retention Nutrient buffering (CEC)

24
25 Biochar Carbon = Energy for microorganisms? Thermodynamically: Enzymatically: CO2 evolution: No problem, 30 GJ/t??, especially at low O:C ratio s Low in soil incubations
26 Relation SOM-plant available water (pf 2-4.2) SOM % Plant available water mm
27 Water retention Plant available water Gravity
28 Water retention Interreg Biochar Project
 5757 5763 SMITH AND FLETCHER")
29 Pore size distribution K. Sun et al. / Bioresource Technology 102 (2011) SMITH AND FLETCHER UNIVERSITY OF STRATHCLYDE pf 4.2: 200 nm
30 Water infiltration Interreg Biochar Project
31 CEC reclaimed peat soils
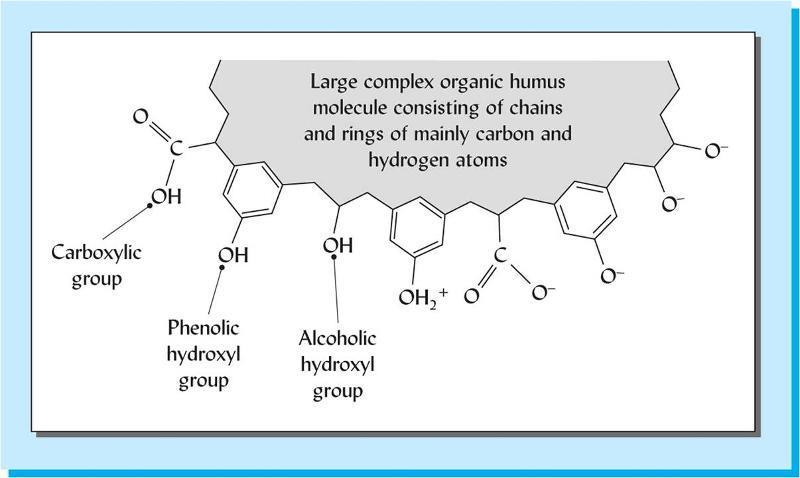
32 Humic Acid structure C:O Fulvic acids: 1 Humic acids : 0.55 Hatcher et al 1994
33 NO 3 - NO 3 - NH + 4 K + Ca ++
34 CEC (cmol/kg) fulvic acids fulvic acids 400 compost-carbon 400 compost-carbon humic acids vermiculite smectite humic acids vermiculite smectite clays clays 20 clay loams 20 clay loams loams and silt loams loams and silt loams biochars fine sandy loams fine sandy loams sands 1 sands 0 0
35 Biochar Evidence in Soil Properties Microbiology, nutrient delivery Water retention Nutrient buffering (CEC)
36 Modification of Biochar Activation (?) Adsorption of SOM Biological modification (?) Chemical modification Functional groups CEC Functional groups AEC (NR 4+ )
37 1. Biochar North Sea ring trial 2013 crop yield Dry matter grain/potato yield (ton/ha) Grain/potato BE DE DK NL NO SE UK Dry matter straw yield (ton/ha) Straw BE DE DK SE UK Control Biochar Field trial sites Field trial sites => No significant differences 37 ILVO
 250 200")


38 3. European biochar field experiments Relative crop yield (control = 100) Light soil texture Medium soil texture Heavy soil texture 127 site - biochar type dose year combinations 75% not significant 17% positive effect 9% negative effect 0 cereal sugar beet potato maize legume carrot beetroot spinach grass rice onion sunflower oil seed rape 38

39 Principal study: Root growth of common bean in a sandy subsoil with increasing biochar concentrations Emilie M. Ø. Hansen, BSc project; KU Science % biochar
 75 cm subsoil ± biochar ~30 cm subsoil (for drainage) 30 cm (asphalt) Root deter at end Soil is throug and cu cm (su cm (top O % (Control) ½ % 1 % 2 % 4 % 2 % (Wood-biochar)")
40 Soil column The experiment Root determination Spring Barley, 18 columns, six subsoil treatments (n=3) Water and nutrient (~200 kg N ha -1 ) supply in excess Subsoil treatments : ( cm, n=3) ~25 cm topsoil (plough layer) 75 cm subsoil ± biochar ~30 cm subsoil (for drainage) 30 cm (asphalt) Root deter at end Soil is throug and cu cm (su cm (top O % (Control) ½ % 1 % 2 % 4 % 2 % (Wood-biochar) Straw-biochar incorporation


41 Root coverage at different depths
42 Energy or C-sequestration?


43 LCA
44 Biochar energy content MJ/kg -1 Pyrolysis Commercial Softwood Pellets Anaerobic Digestate Mixed Wood Chip Green Waste Biochar HHV Liquid HHV Syngas HHV Markus Roedger, Biochar Climate Saving Soils

45 LCA results Markus Roedger, Biochar Climate Saving Soils
46 Conclusions Biochar can be used to sequester short cyclic C in the soil Biochar is rather different from SOM Application of biochar in agriculture? Not Yet Energy or C-sequestration?
47

48 Biochar Alternative model

 faculty.")
49 Biochar Refuge for micro-organisms? Biochar Humic acid Clay Sohi et al (2009) faculty.yc.edu/ycfaculty/ags105/week08/soil_colloids/soil_colloids_print.html


50 Hydrophobic interaction Fluidized bed reactor Mussati et al, 2005
51 WHC effect biochar Streubel et al, 2011, JSSSA, 75:
52 CEC reclaimed peat soils
53 Humic Acid structure C:O Fulvic acids: 1 Humic acids : 0.55 Hatcher et al 1994
54 Water infiltration Interreg Biochar Project
55 CEC reclaimed peat soils
56